
SPX Relief Bounce Secured, now What?
Last night’s bullish reading (our primary scenario) shared in the newsletter played out well Thursday, with SPX holding the 50-day test at 7678 and rebounding to our first rebound target at 7750. GEX flipped back to positive for SPX, though GEX remains negative for QQQ. The VIX is in decline and appears to be headed for a 15.50-16 test, though bulls need to be concerned that the 1-hour VIX chart is already almost oversold according to the %b indicator, so a volatility rebound appears likely sometime soon again.
Interested in getting access to our tools, trades, and our most active Discord channels? Save $300 off of the annual Portfolio Manager plan with code PUMPKIN300 at checkout!
SPX Closes at Resistance, Watch for Another Move Toward 7800 if 7700 Holds
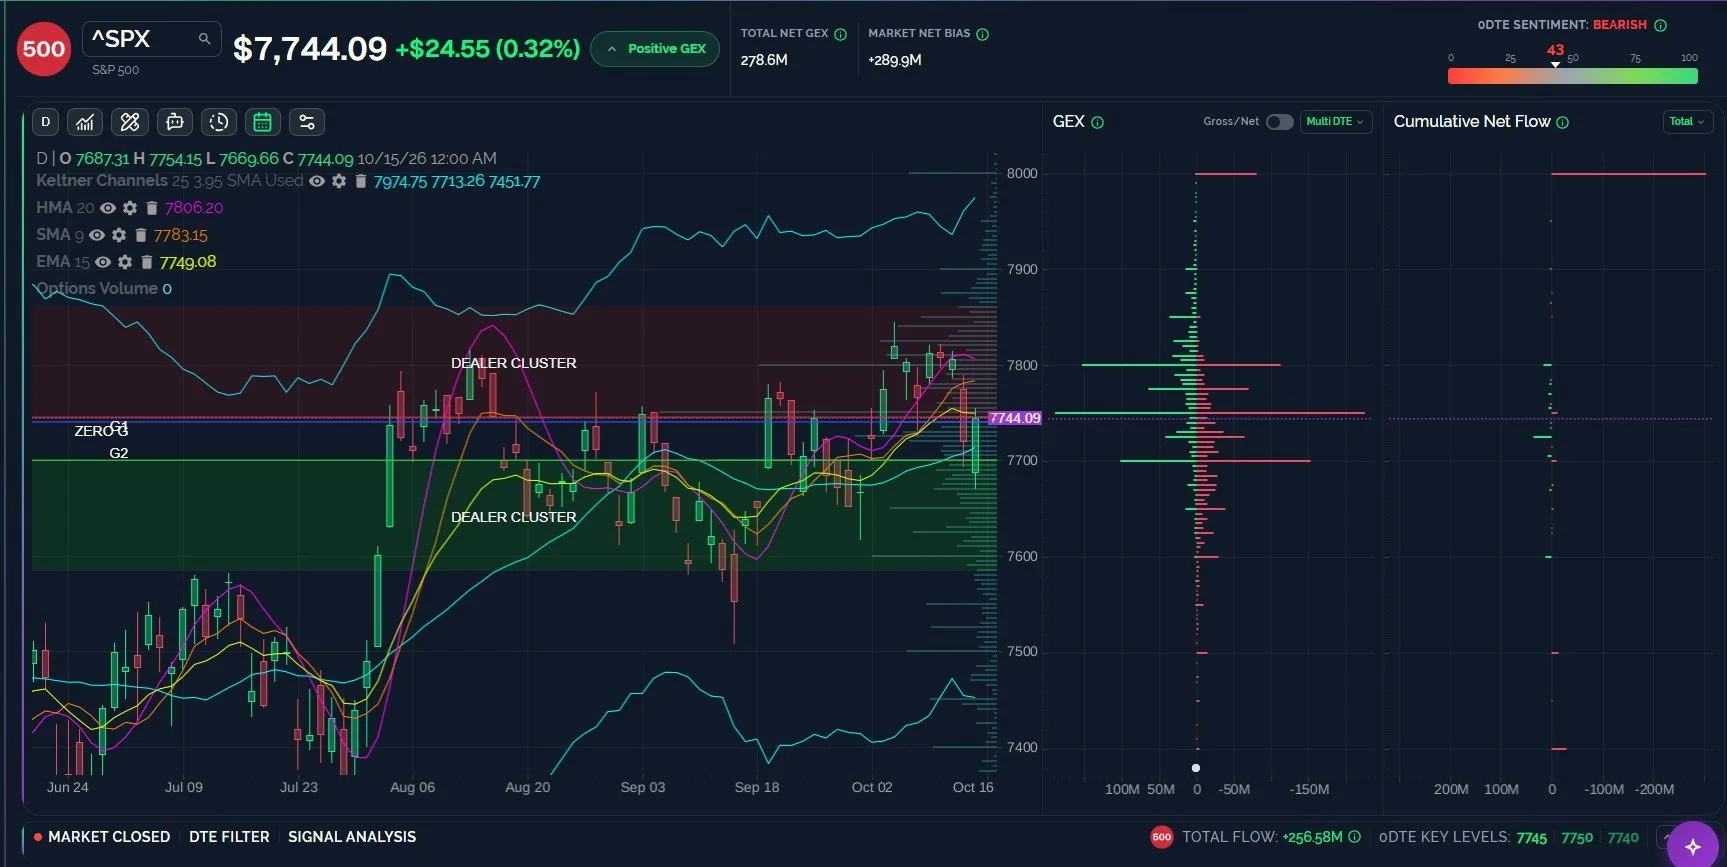
SPX tested the daily 15-EMA Thursday, reaching a high of 7754 before closing just below 7750. The chart below shows gross GEX filtered for tomorrow and next week to the right of the chart, reflecting the significance of the 7700-7800 range as we enter OpEx Friday. Whether SPX visits 7800 Friday or next week, I think it’s highly likely we get close to 7800, in part because the HMA and 9 SMA are still overhead and haven’t yet been tested by SPX during this bounce. Mean reversion back toward the HMA was one of our stated reasons for being bullish after yesterday’s relatively lengthy extension below the HMA. With SPX closing just below 7750, which is GEX and technical resistance for now, it’s possible SPX retests 7700 again, but I don’t have any interest in shorting unless GEX shifts and SPX loses 7700, or if we see signs of topping near 7783-7800.
-Primary scenario: SPX either gaps up toward the 7780-7800 area, then reverses in the afternoon, or gaps down and then rallies to the same 7780-7800 destination.
-Alternative scenario: SPX gaps down, loses Thursday’s low and heads toward 7600, creating a big mess.
Key Levels: Bullish above 7750 targeting 7780, then 7800. Bearish below 7700 targeting 7650, 7600.
QQQ has Room to 740, Downside risk to 710 is still Present
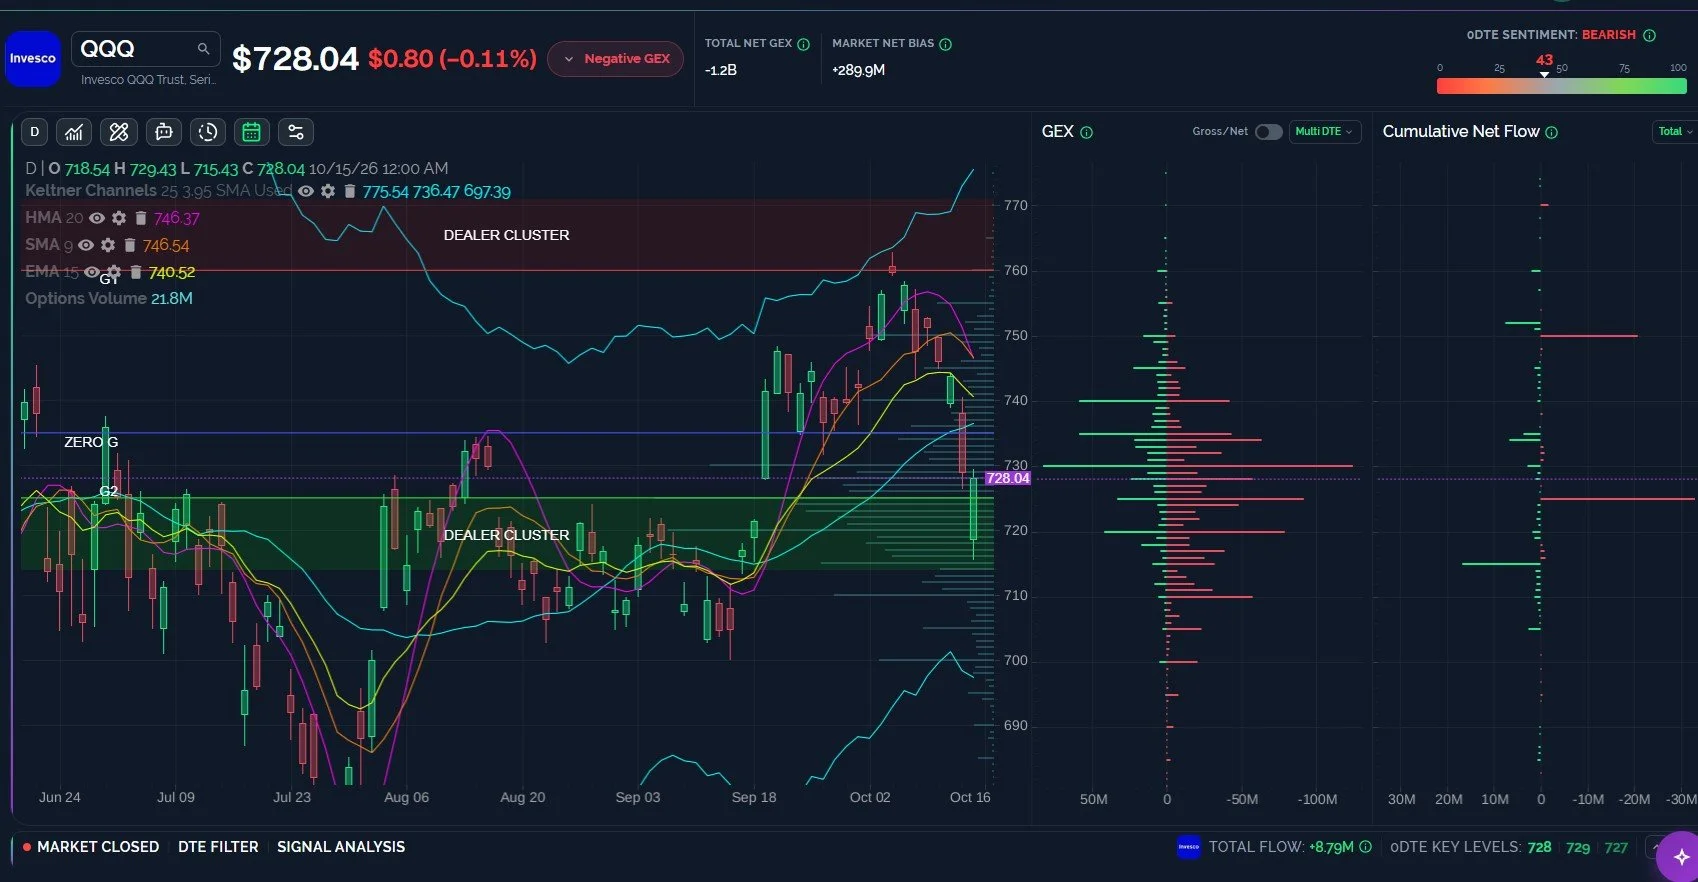
GEX worked great with QQQ Thursday, with 715 showing as the last large 0 DTE GEX cluster to the downside, marking a low for the day. At that time, I posted in Discord that I was long QQQ and semiconductors. QQQ ended up nearly reaching 730, and we saw a close not far from highs. One difference between QQQ and SPX is that QQQ still shows net negative GEX, while SPX closed in positive territory. I typically defer to SPX in terms of signal value when they disagree, but it’s worth nothing that they paint slightly different pictures. Such differences sometimes occur at extremes, or we could possibly see SPX outperform QQQ, though it’s very unlikely they would become inverse one another when they share some large common top holdings/index components. QQQ’s most bullish argument right now is a contrarian argument surrounding mean reversion, and QQQ is quite far away from all of the moving averages I have on my chart. GEX spans the 710-740 range, and I think it’s likely we see 740 as long as 720 holds.
-Primary scenario: QQQ holds any weakness toward 720 and bounces toward 740 by the end of Friday.
-Alternative scenario: QQQ loses 720, testing 710 and potentially lower before rebounding toward 720.
Key Levels: Bullish above 730 targeting 740. Bearish below 720 targeting 710, 700.
NVDA has Upside Potential to 230, Risk to 200 on the Downside
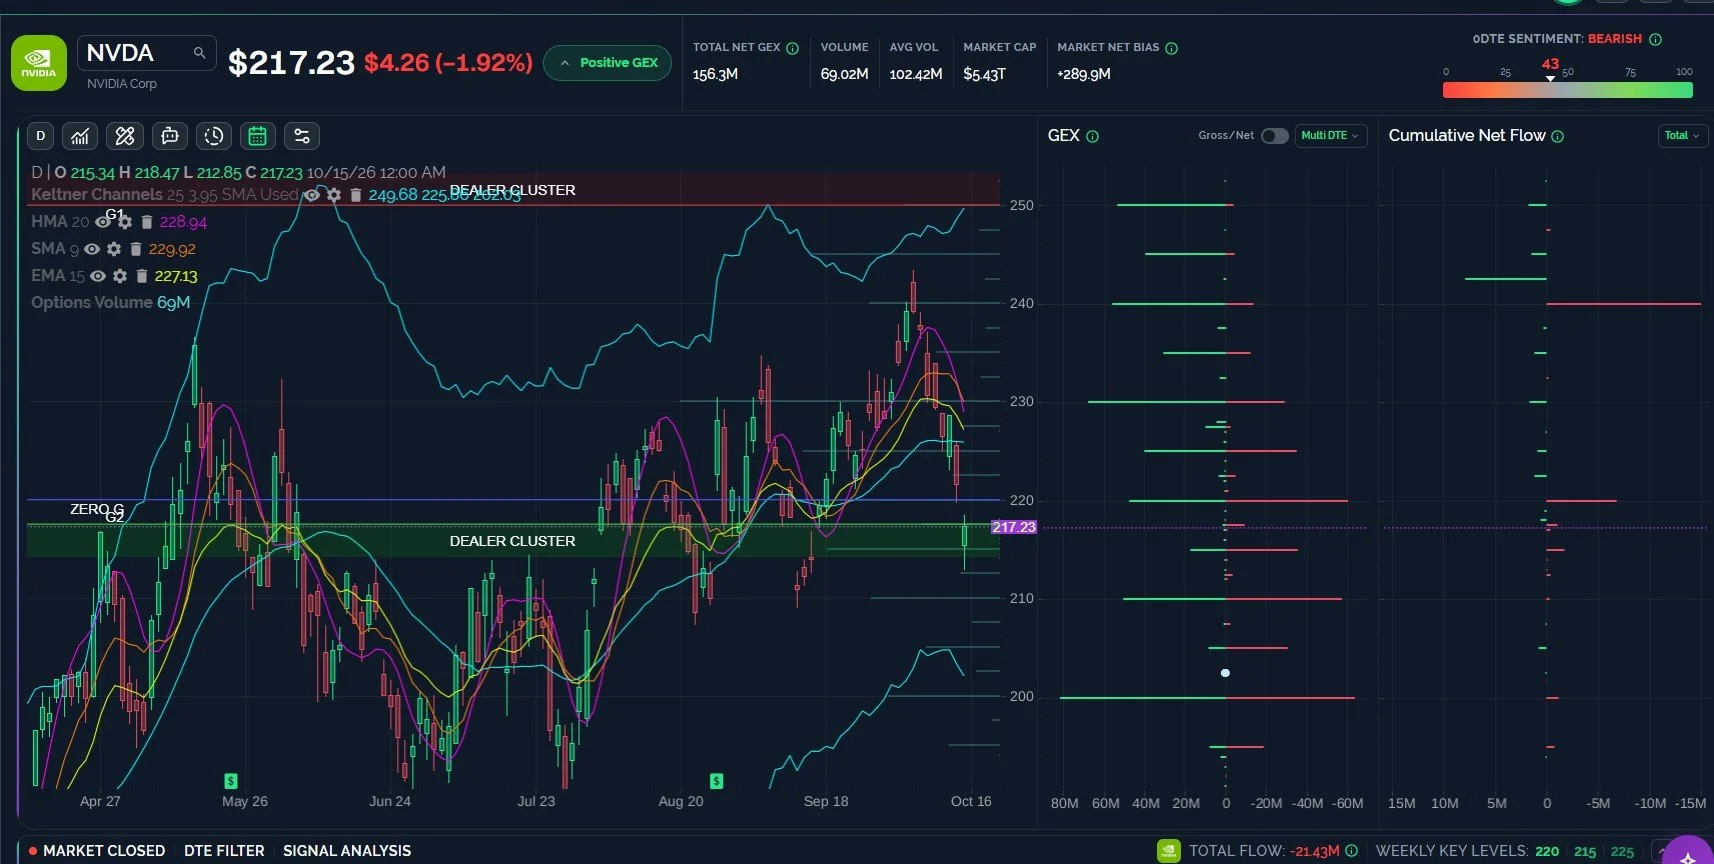
The semiconductors have been hit really hard lately, with a lot of them showing negative net GEX. NVDA shows positive GEX, with a wide dispersion of GEX across a 50-point range. The largest net positive GEX cluster is at 250, which represents nice potential upside, but we also see multiple large GEX resistance/support levels between 200-230. While NVDA ultimately may tag 200 in an important bottoming process, the near-term likelihood may be centered around a potential tag of 210, then a move toward 220-230.
-Primary scenario: Regardless of starting higher or lower, NVDA targets the 230 zone for a retest of important moving averages.
-Alternative scenario: Someone wakes up grumpy Friday and pushes NVDA to 200-210, with 220 becoming the upside target.
Key Levels: Bullish above 220 targeting 230. Bearish below 220 targeting 210, 200.
The VIX can see Another Spike from 15.5-16, Watching an Initial Retest of 17-18
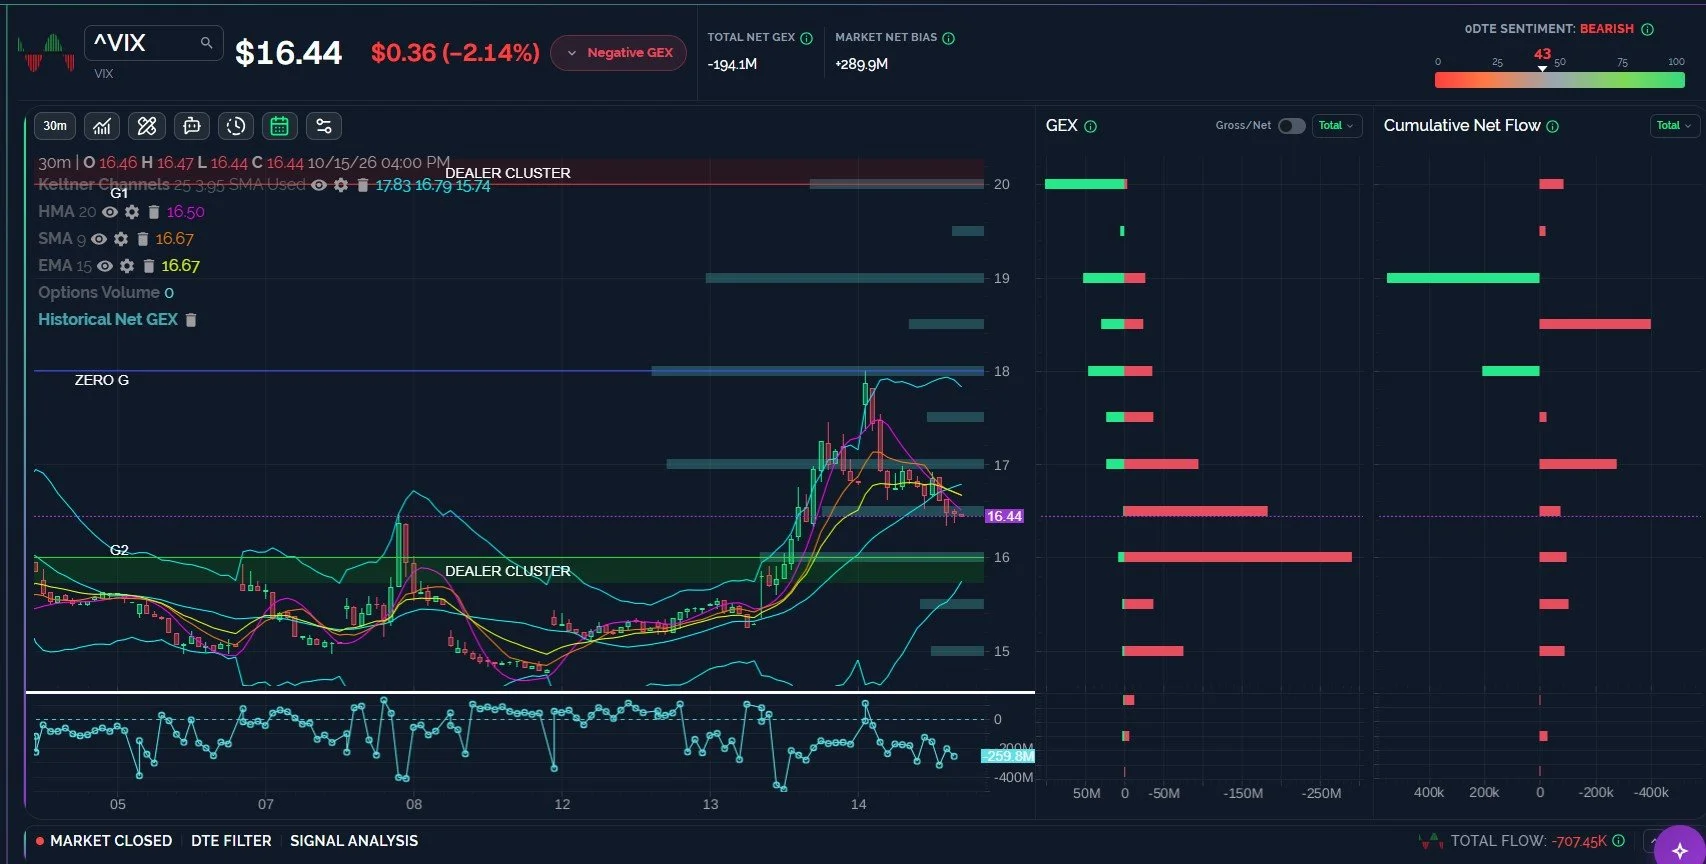
Net GEX for the VIX has moved even more negatively, and the chart indicates lower VIX levels seem likely. But with the 1-hour Keltners still showing an uptrend, and the %b (20,2) showing the VIX to almost be at oversold levels, such a drop may not have a lot of room. 15.5-16 appears as an initial range for a rebound in volatility. If the VIX reaches 18 soon, we can reassess the prospects for the VIX reaching 20+.
-Primary scenario: The VIX retests 16, even if starting out higher. 15.5 marks the ultimate bottom before s spike.
-Alternative scenario: The VIX gaps down to 15, then consolidates before moving higher.
Key Levels: Bullish above 17 targeting 18, 20. Bearish below 16.5 targeting 16, 15.5
Join The Discussion
Non-subscribers can join our great Discord community with all of its experienced traders by clicking Community on our homepage. First-time guests get a free 7-day trial of the premium Discord channels, where we talk through what is happening in real time.
Our YouTube videos can be viewed by clicking Community at the top of our homepage to find the channel link. We posted a new YouTube video tonight discussing major indices as well as some individual stocks, so check it out!
Join our livestream by clicking the link on our homepage every day around 10:30am ET, and you can replay the most recent one any time before the next one begins. We also post a link in Discord when we’re ready to start.
We now have a live demo on our homepage for those who want to explore the main sections of our website, so we invite non-members to check it out!
Thanks for being part of our community and know that we invite and appreciate your feedback!
The information provided by Geeks of Finance LLC is for educational purposes only and is not intended to be, nor should be construed as, an offer, recommendation or solicitation to buy or sell any security or instrument or to participate in any transaction or activity. Please view our Investment Adviser Disclaimer and Risk Disclosure.
