
The VIX Wicks Above 17, still Holds key Trendline
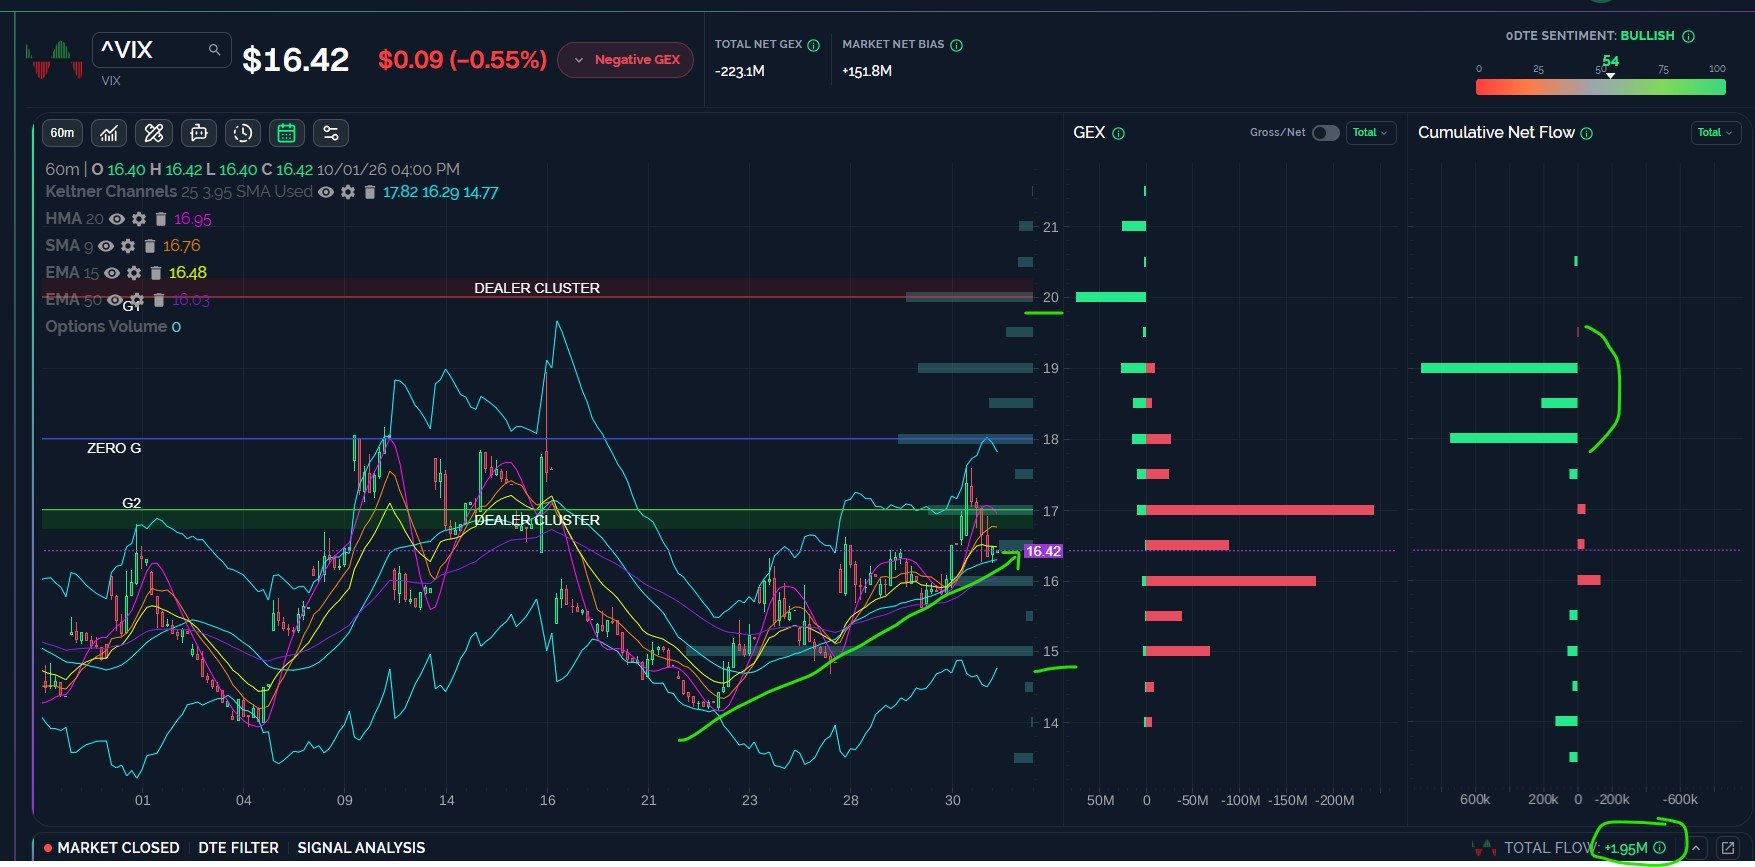
SPX almost reached 7600 today, stopping at 7616.78 before rebounding sharply. SPX still closed below key resistance, yet it closed above the 7650 level again, so we’re left with two uncertain pathways not too different than what we were considering yesterday. The VIX looks somewhat hopeful for market bulls as we see a large wick on the daily candle, closing below 17, yet the 1-hour trendline is still in play. Let’s look at some levels that might serve as catalysts for momentum in either direction.
Interested in getting access to our tools and most active Discord channels? Save $300 off of the annual Portfolio Manager plan with code SEPTEMBER26 at checkout!
Bulls Want to see the VIX Lose 16 to Signal Better odds of SPX Rally
The VIX has been in a negative GEX environment for 4 days now, with most of that negative GEX being at a higher strike, not lower strike, so a bit unusual for a negative GEX environment. The VIX reached the largest negative GEX cluster at 17 today, rejecting from the mid-17s to close right at the 1-hour trendline. While the daily candle left a long wick overhead, it’s hard to have much confidence that volatility is done expanding until we see the VIX lose 16, at which point it may drop to 15. Cumulative net flow shows positive option activity at the 18 and 19 strikes today, and another move past 17 may target 20.
-Primary scenario: The VIX drops to retest 15, breaking the tight uptrend in play since the 22nd, but bottoming around 15, maintaining the uptrend visible on the Keltner channels. The VIX then moves back up.
-Alternate pathway: The VIX begins higher Friday, tagging 18-19, then fading back down toward 16.
Key Levels: Bullish (for the VIX) above 17 targeting 20. Bearish below 16 targeting 15.
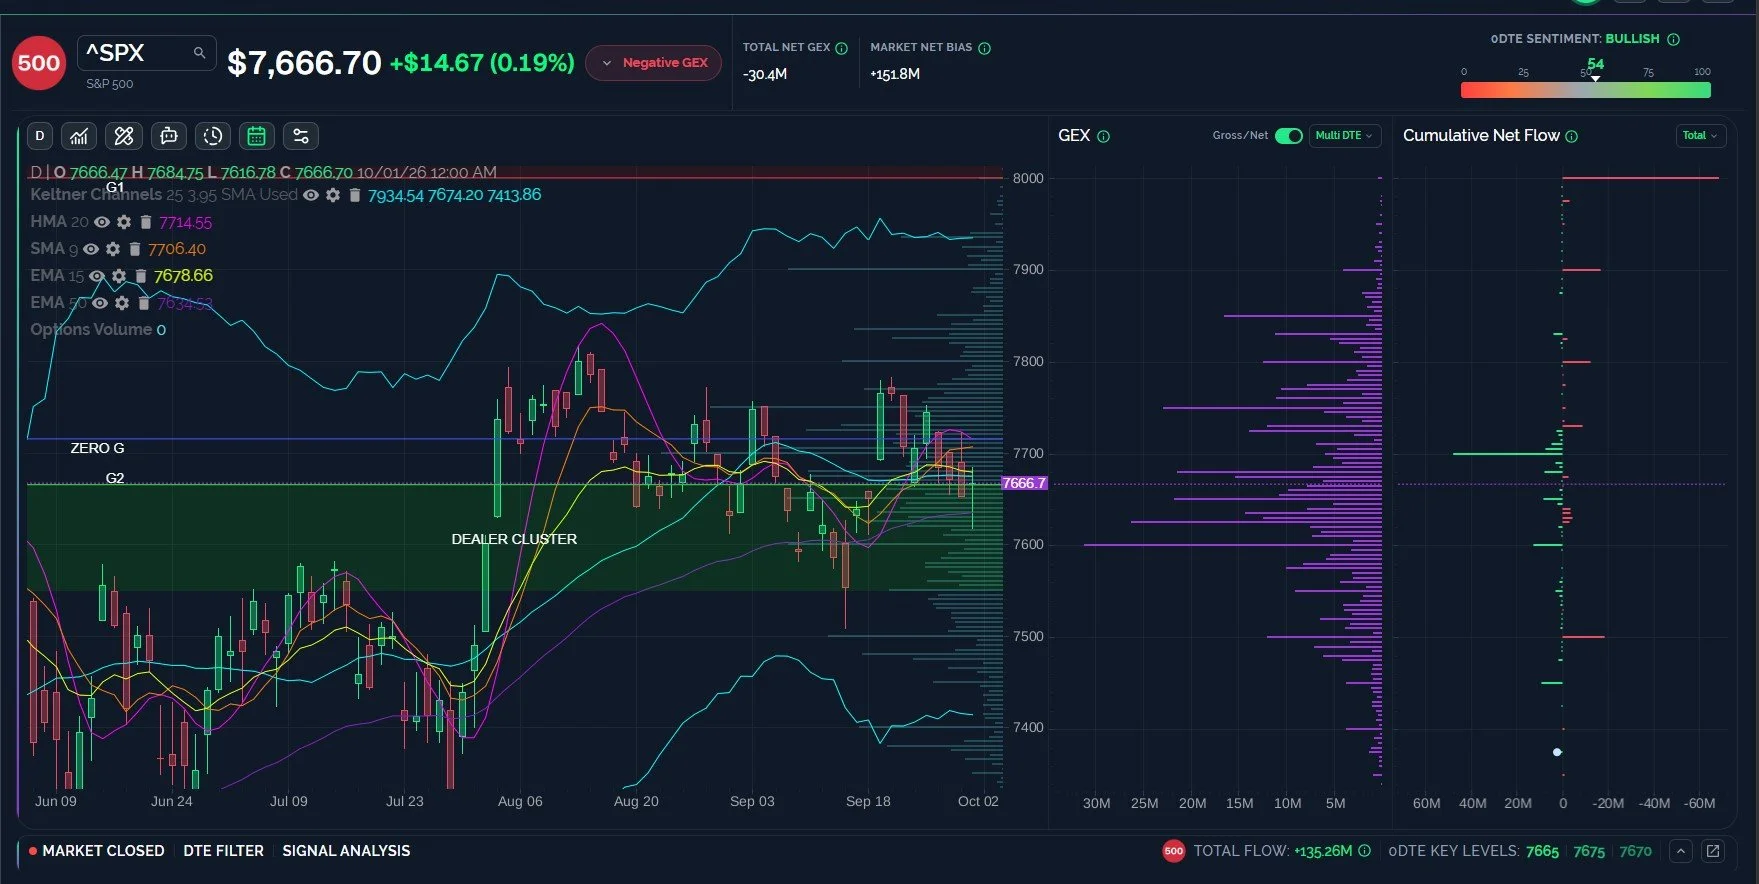
SPX still Reflects Risk to 7600, Bulls Need to Recapture 7700
The GEX problem for SPX right now is that net GEX is negative, even though we have a clear dominant range (in terms of where most GEX is concentrated) between 7600 and 7850. 7500 is large enough to keep one chameleon eye open and independently swiveled in its direction though, especially if we see a daily close below 7600. The other problem is the close below the big GEX clusters at 7675 and 7680, placing the burden of proof upon SPX to either gap above 7680, or capture both of those areas during the cash session. SPX is also below all of the key moving averages on my chart. Not a great look, Donny!
The price action resulted in a doji with a long tail, also known as a dragonfly doji, typically associated with bullish reversals. SPX also bounced strongly off of the 50 EMA. So this is where we see conflicting data points, which we take into consideration as we prioritize what we decide is most likely, in our view:
-Primary Scenario: SPX rallies to the 9 SMA and HMA between 7710-7715, then fails again, potentially falling to 7600 or lower.
-Alternate Scenario: SPX opens a bit lower, maybe 7625-7650, then rallies to 7715. A close above 7715 is bullish, in our view.
Key Levels: Bullish above 7715 to 7750. Bearish below 7650 to 7600.
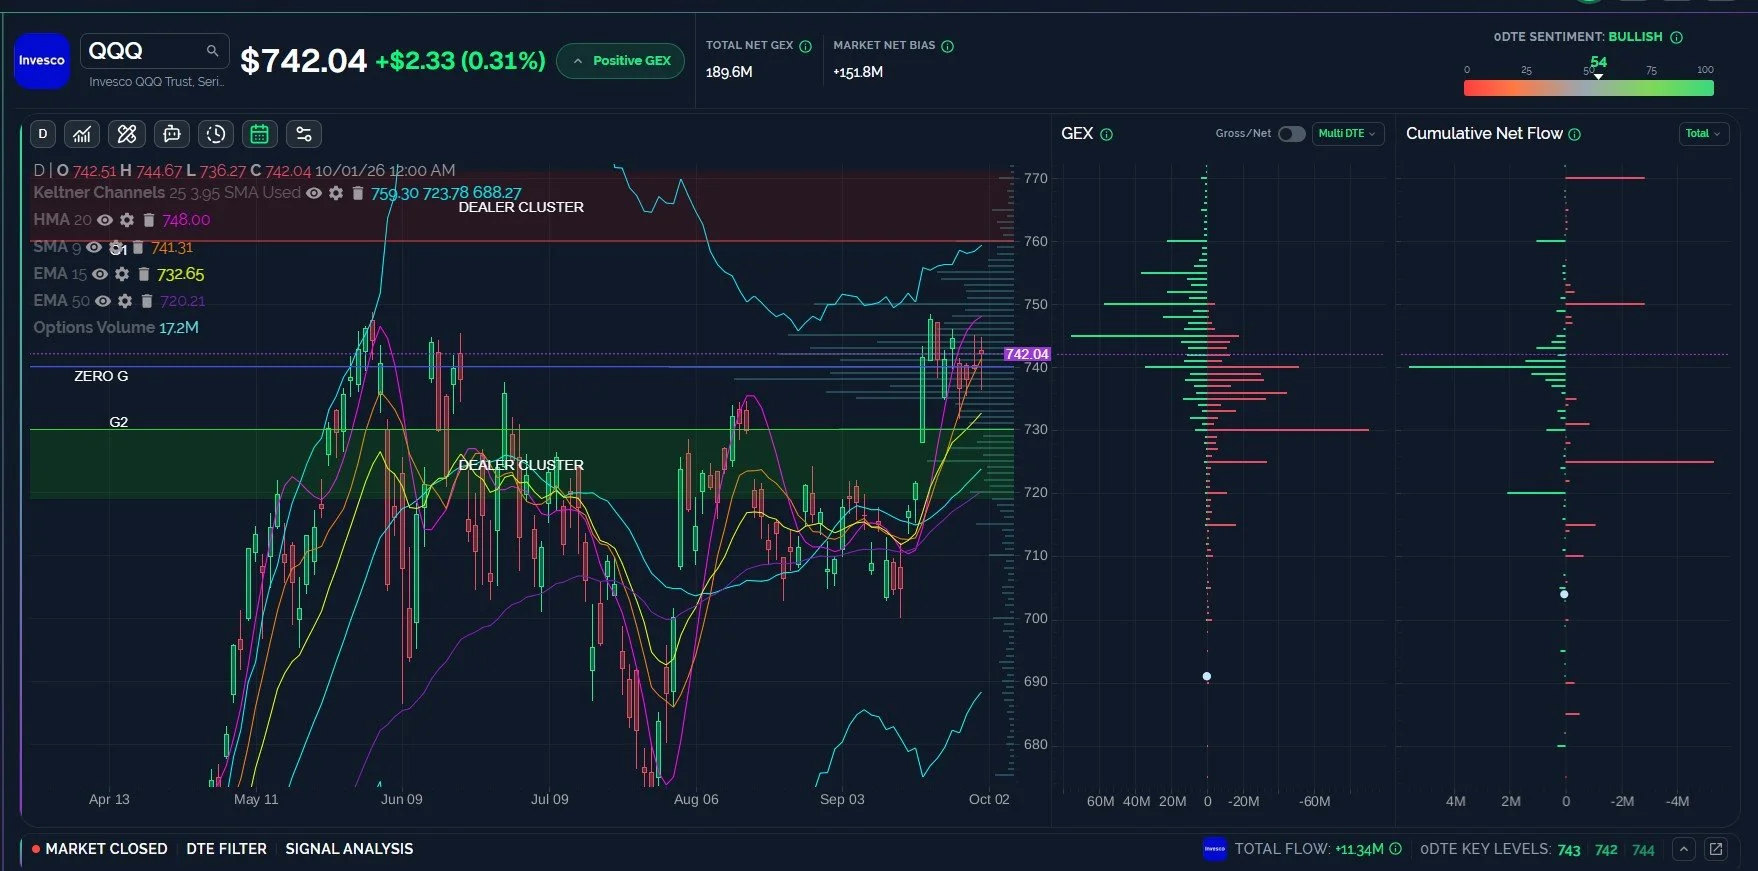
QQQ may Reach 750, Concerns Loom due to Limited Upside Picture
QQQ GEX does leave open the possibility that we see a move to 760, but most of the positive GEX (for now) is concentrated at 750 or lower, at least for the next two weeks (selected below). The upper Keltner channel is rising, which looks bullish, and QQQ has definitely acted more bullish than SPX lately. The two concerns toward QQQ center around the large negative GEX at 730 and the inability for price to move over the HMA at 748 for the last 4 days.
-Primary Scenario: QQQ overshoots the HMA and tags 750 before dropping back to 730.
-Secondary Scenario: QQQ holds early weakness around 735, then rallies to 750.
Key Levels: Bullish above 745 targeting 750, 755. Bearish below 740 targeting 735, 730.
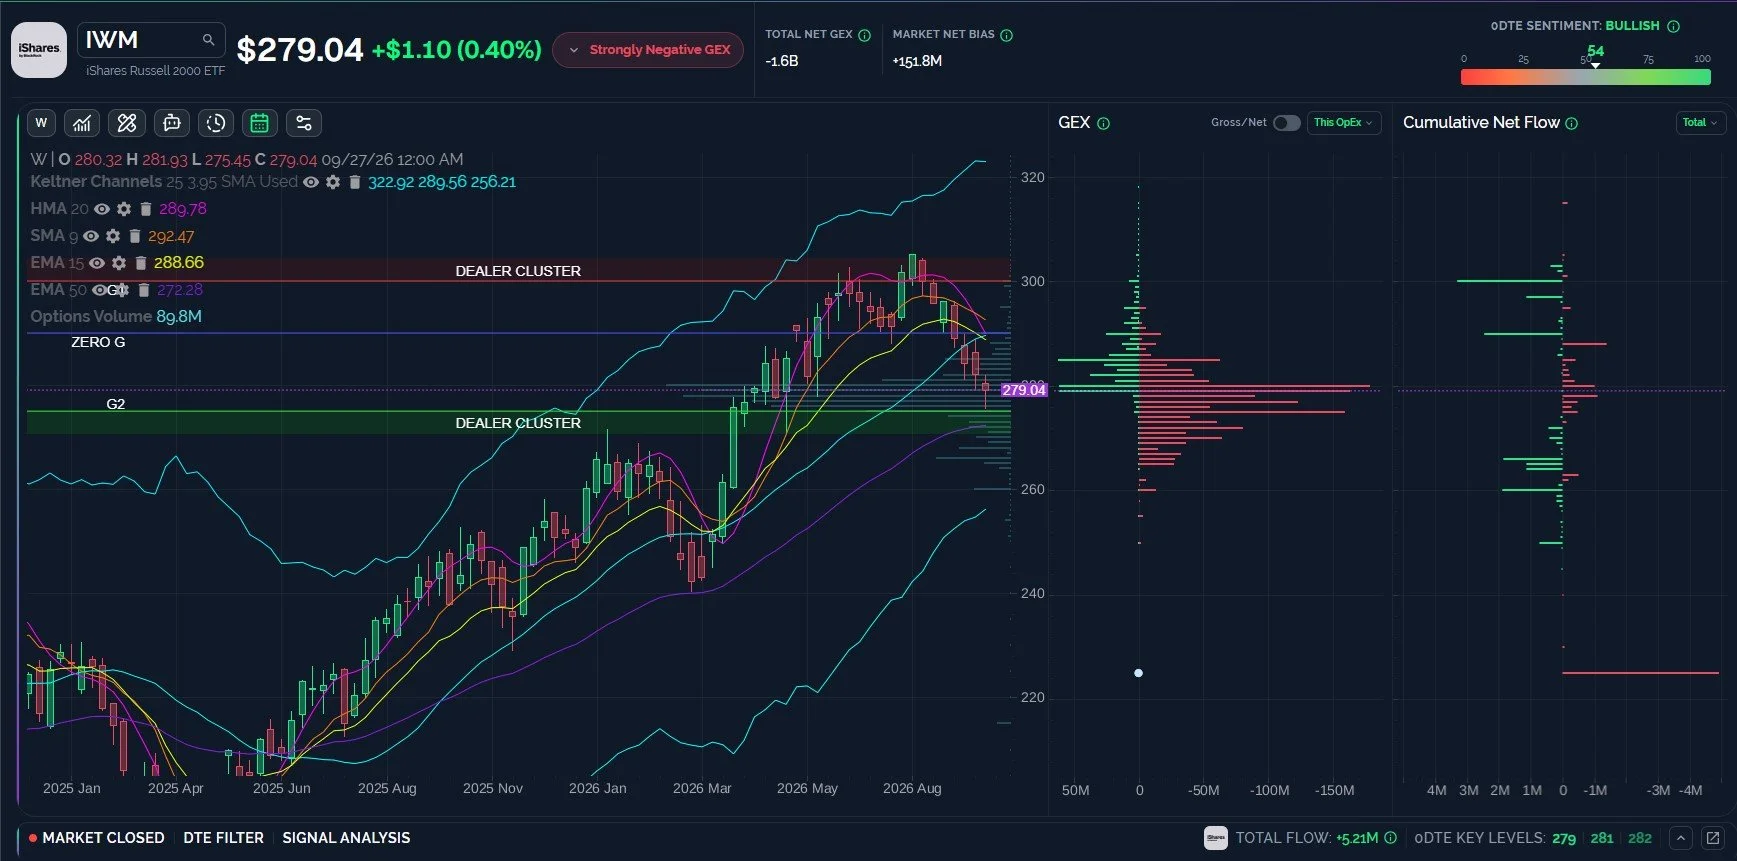
IWM sees Marginal Improvement in net GEX, GEX Indicates Potential Pivot Soon
IWM net GEX is still deeply negative, but it’s been slowly increasing, potentially a positive sign. We expect to see a much larger reversal higher by IWM when it’s finally done with its downside move. IWM almost tagged 275, which we’ve been waiting for, but we may still see IWM tag 272 or 270 before a larger reversal, so we’ll be watching what happens. For now, any bounce toward 285-287 may be sold, so we’ll see what happens at that juncture.
-Primary Scenario: IWM bounces toward 285, then consolidates before the next move.
-Secondary Scenario: IWM drops to 270, then reverses higher.
Key Levels: Bullish above 280 targeting 285. Bearish below 280 targeting 275, 270.
Join The Discussion
Non-subscribers can join our great Discord community with all of its experienced traders by clicking Community on our homepage. First-time guests get a free 7-day trial of the premium Discord channels, where we talk through what is happening in real time.
Our YouTube videos can be viewed by clicking Community at the top of our homepage to find the channel link. We posted a new YouTube video tonight discussing major indices including SPX and QQQ, the VIX, and more!
Join our livestream by clicking the link on our homepage every day around 10:30am ET, and you can replay the most recent one any time before the next one begins. We also post a link in Discord when we’re ready to start.
We now have a live demo on our homepage for those who want to explore the main sections of our website, so we invite non-members to check it out!
Thanks for being part of our community and know that we invite and appreciate your feedback!
The information provided by Geeks of Finance LLC is for educational purposes only and is not intended to be, nor should be construed as, an offer, recommendation or solicitation to buy or sell any security or instrument or to participate in any transaction or activity. Please view our Investment Adviser Disclaimer and Risk Disclosure.
