Indices show GEX that is just barely in the negative, while the VIX maintains a positive GEX reading. The closes were an improvement though, with SPX showing a decrease in negative GEX and a close above the daily HMA. QQQ also closed above the HMA. The potential problems arise when we look at the current weekly GEX, which shows limited upside, and the HMA itself is still steeply declining for SPX and QQQ, a sign of strong momentum to the downside to this point. A decisive close above the downtrend would go a long way in being able to say the drop is likely over.
Interested in getting access to our tools, trades, and our most active Discord channels? Save $300 off of the annual Portfolio Manager plan with code PUMPKIN300 at checkout!
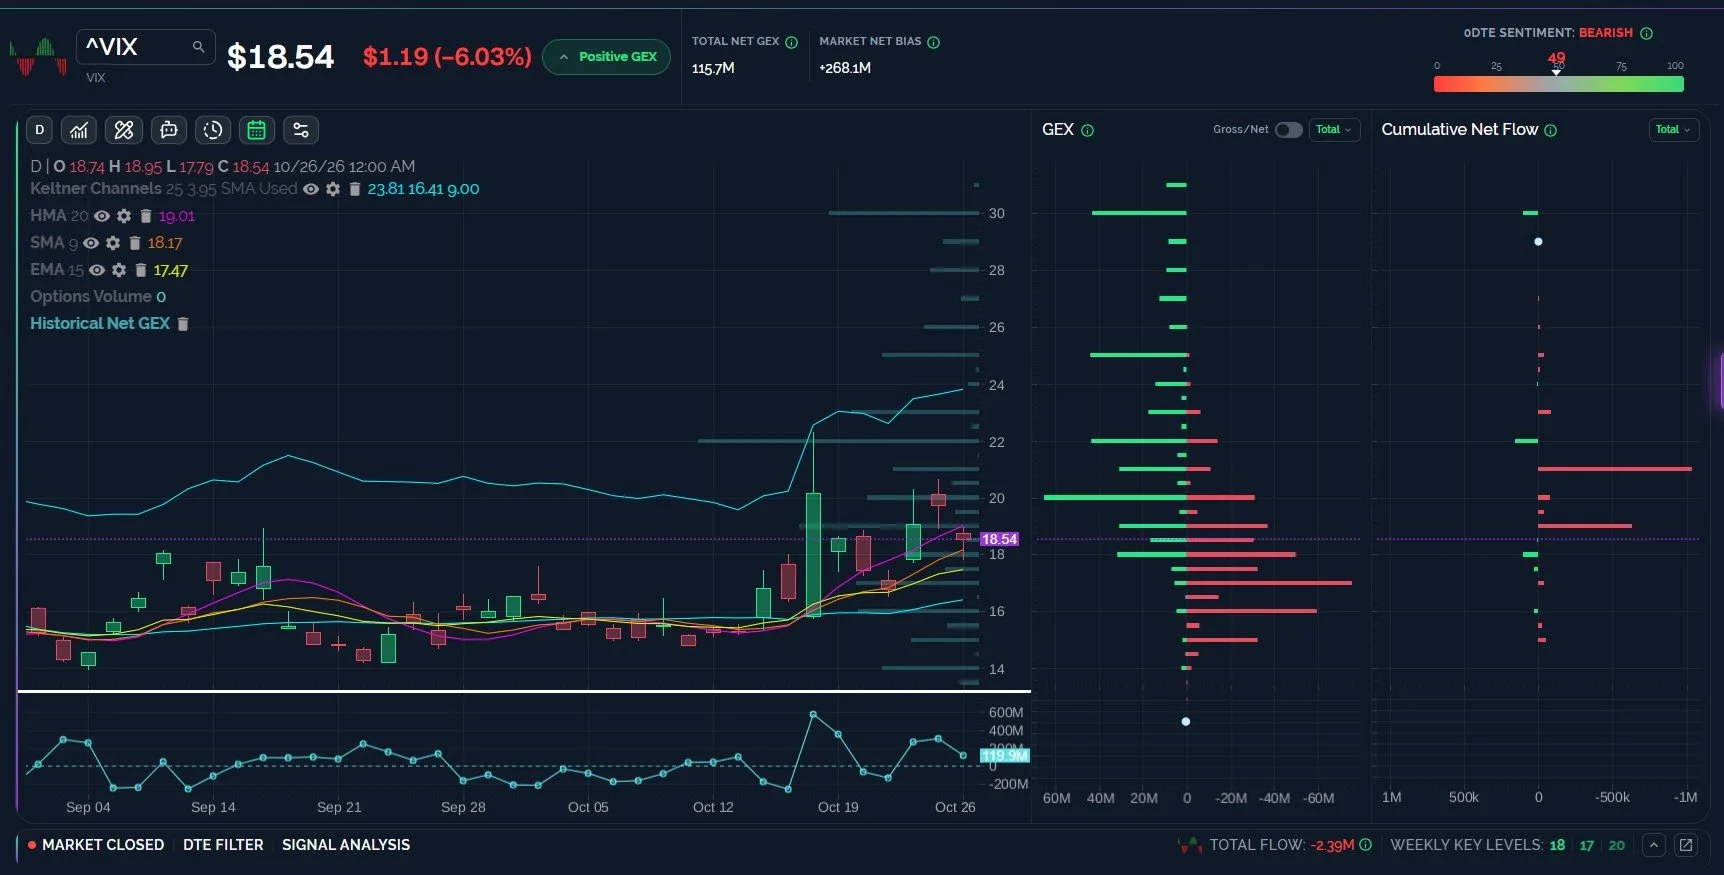
The VIX still Hasn’t Broken the Uptrend to the Downside, 1-Hour Chart on a Buy
The VIX still shows positive GEX, with 20 still representing an important pivot toward more upside for the VIX. Bulls have some encouraging movement with the VIX closing below the daily HMA, but a break below Wednesday’s low near 17 would be more convincing. The 1-hour chart shows a bullish (for volatility) cross-over of the HMA, so a retest of 20 might be in order.
-Primary scenario: The VIX holds any intraday retest of 17 and ends up testing 20 before another decision.
-Alternative scenario: The VIX collapses into big tech earnings, dropping to 15-16 and consolidating in that range for some time.
Key Levels: Bullish above 19 targeting 20, 22. Bearish below 17 targeting 16, 15.
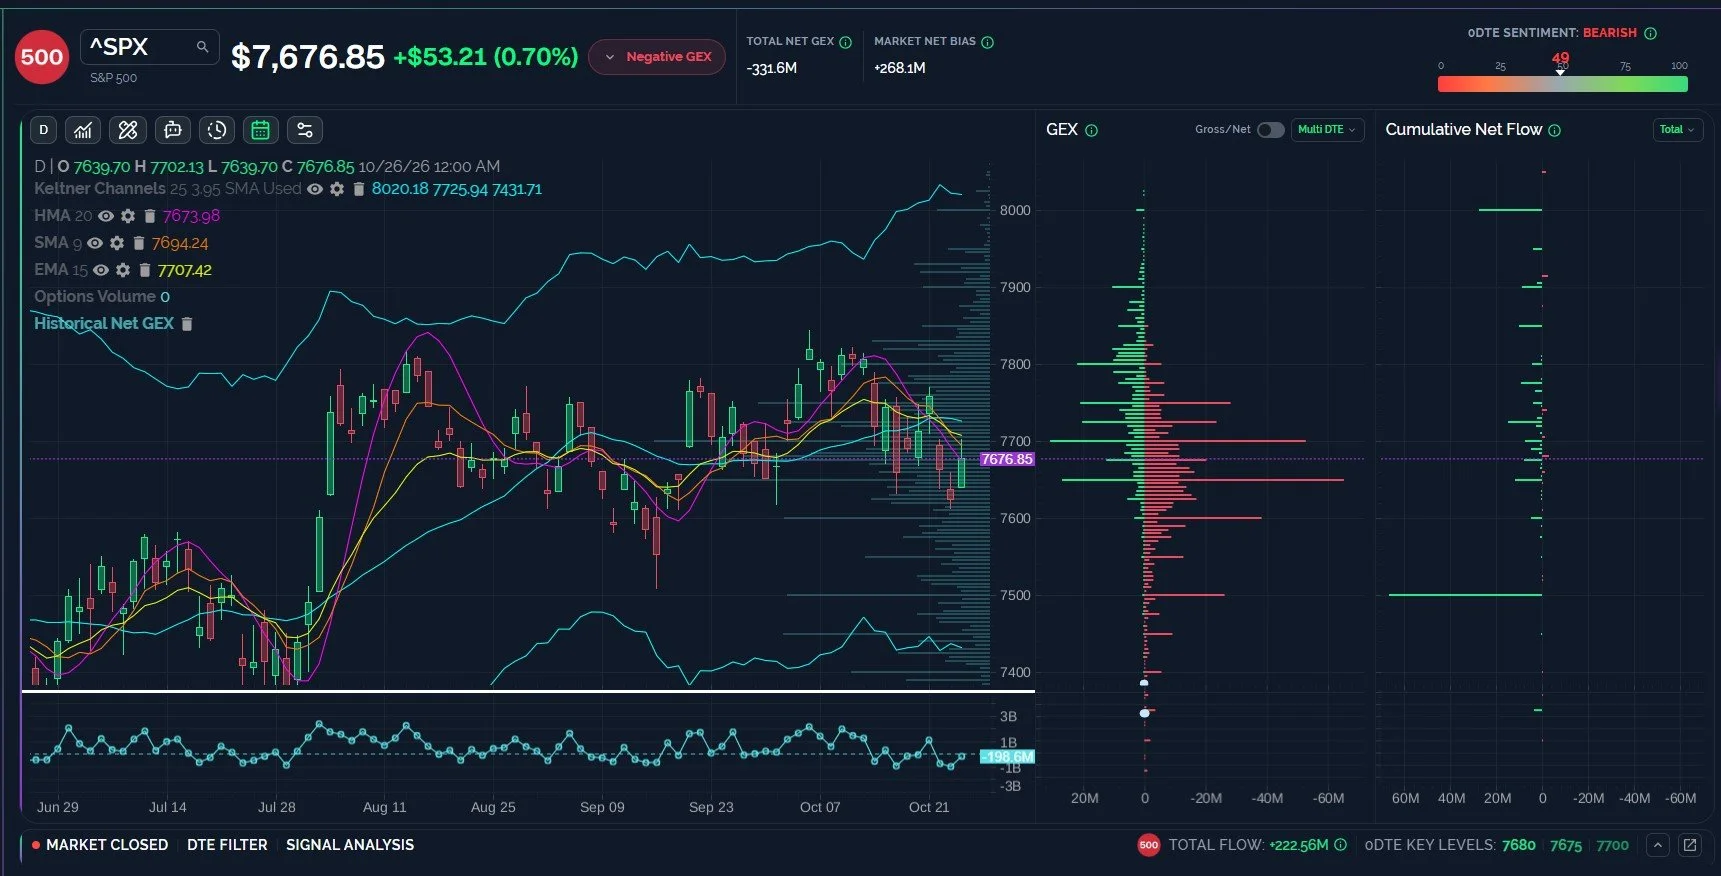
Three Largest GEX Clusters for SPX this Week are all Lower
I show gross GEX in the chart below to illustrate the significance of the “ceilings” that start at 7700 all the way up to 7750. These are potential GEX areas that aren’t large on a net basis, but they have a lot of GEX on both sides of the zero line. Closing above 7750 would be significant, opening the door to 7800-7900. However, the 3 largest net GEX clusters are all lower for this week: 7650, 7600, and 7500. Is it time for SPX to test the lower Keltner channel, or close to it at 7500? It’s hard to count on that during earnings week, but tactically, be aware of the possibility on a close below 7650.
-Primary scenario: SPX remains rangebound between 7600-7700 until at least MSFT and GOOGL report Wednesday, maybe even AMZN on Thursday.
-Secondary Scenario: SPX surprises to the upside, closing above 7700 and seeing GEX shift more positively as the week progresses.
Key Levels: Bullish above 7700 targeting 7725, 7750. Bearish below 7675 initially targeting 7650, 7600.
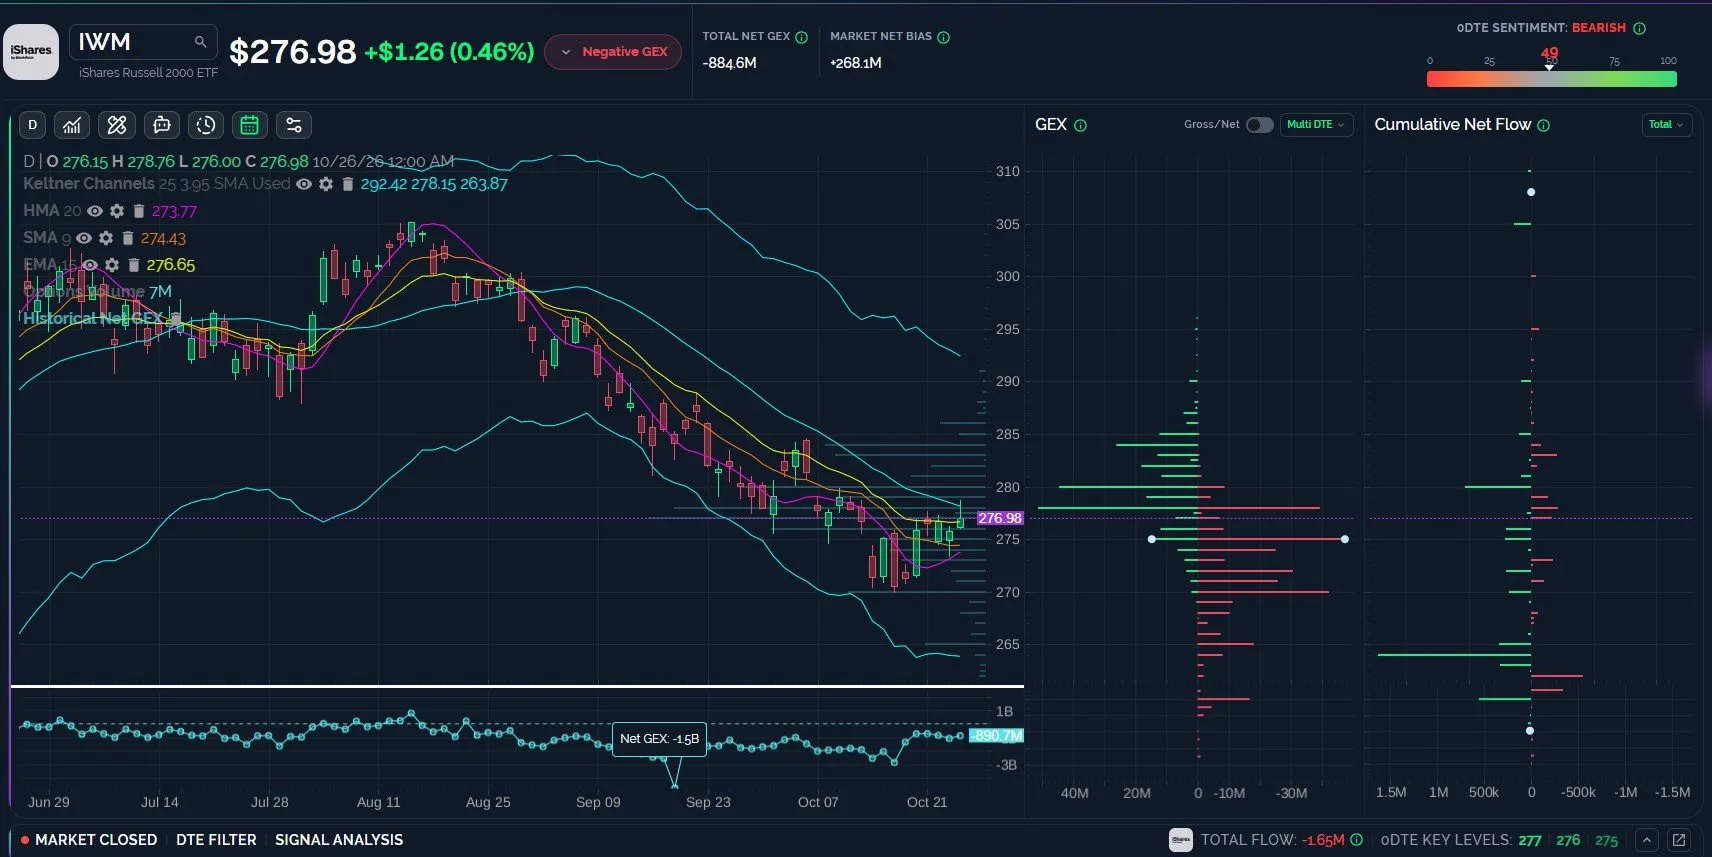
IWM Looks the Most Bullish, but Upside Might be Limited Beyond 285 (for now)
IWM seems to have turned a corner in the short run, maintaining relatively modest negative GEX readings on a daily basis and showing an ascending wedge looking back over the last two weeks. Price action surrounding any test of 280-285 will be key in determining where IWM goes next: Will this wedge end in a breakdown to test 265, or is this the beginning of a climb into year-end for IWM?
-Primary scenario: IWM reaches 280-285, rejects and continues consolidating between 270-280 for now.
-Secondary scenario: IWM breaks down and reaches for 270 immediately, potentially 265.
Key Levels: Bullish above 277 targeting 280, 285. Bearish below 275 targeting 270, 265.
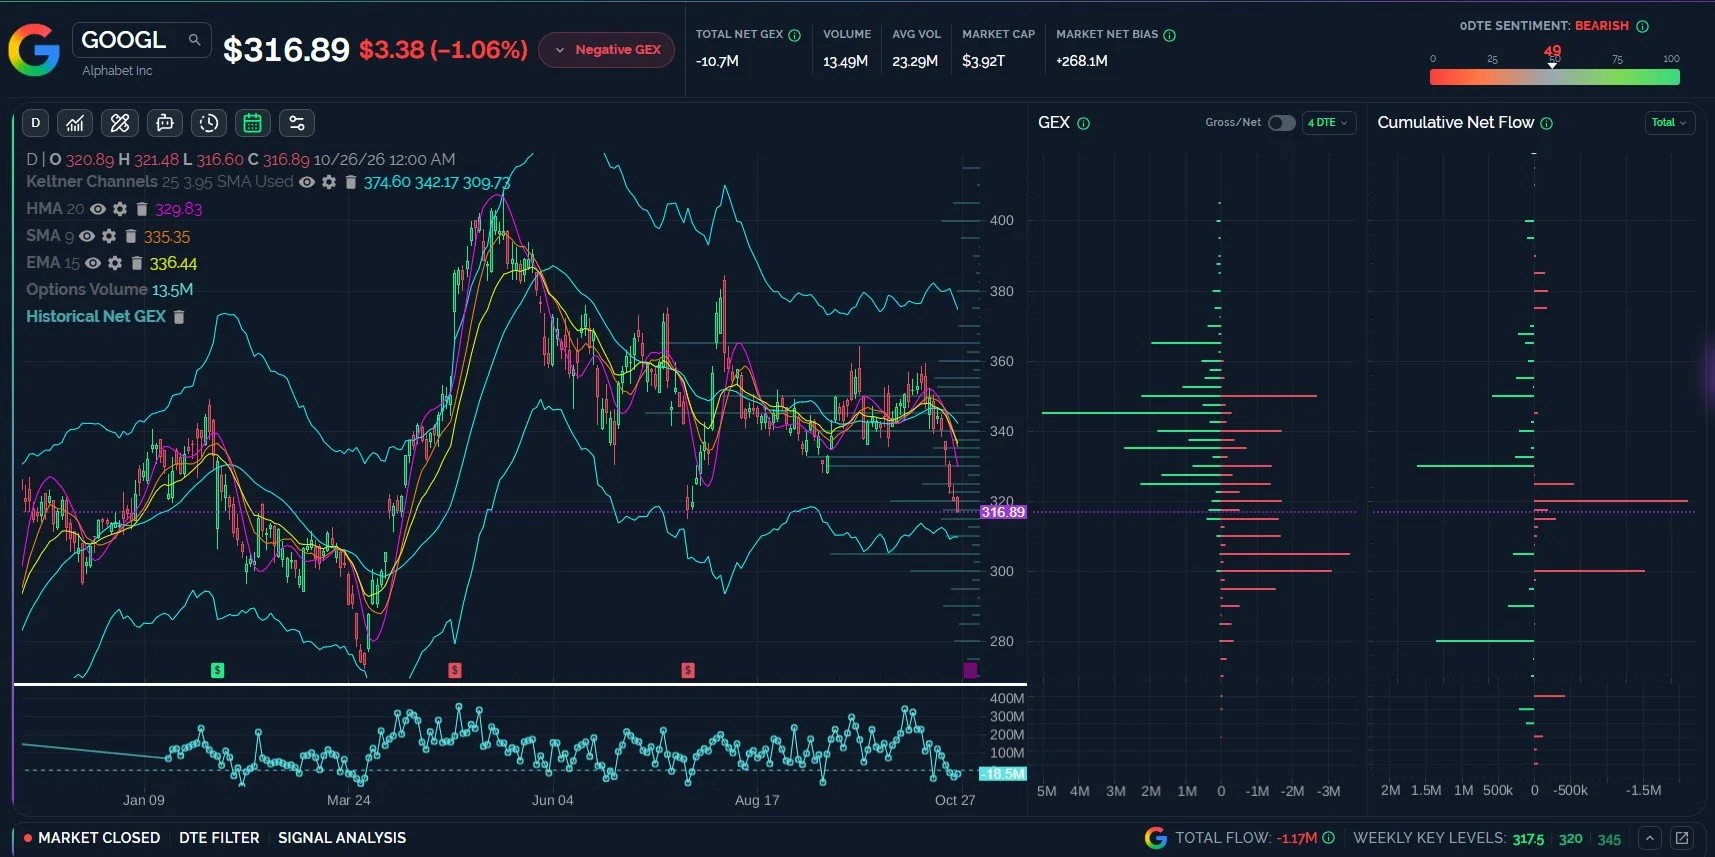
GOOGL may be a Contrarian buy into Earnings Wednesday
GOOGL is near the lower Keltner channel, and while GEX is negative, filtering for this week’s GEX shows the largest clusters at 345 and 350. Downside appears limited to 300-305 based on GEX, and a review of prior GEX readings this negative shows a strong tendency toward bouncing for 1+ days. We also see prior earnings action (the candles above the little rectangles with $ signs) overwhelmingly positive, though sometimes the buying doesn’t start until after a gap down.
-Primary scenario: Any further downside for GOOGL ends up with bears being euthenized as GOOGL move back toward 345-350.
-Alternative scenario: GOOGL stays persistent in pushing lower below 300 as the moving averages continue dropping and the Keltners turn lower.
Key Levels: Bullish above 325 targeting 345-350. Bearish below 300 targeting the lower Weekly Keltner at 271.
Join The Discussion
Non-subscribers can join our great Discord community with all of its experienced traders by clicking Community on our homepage. First-time guests get a free 7-day trial of the premium Discord channels, where we talk through what is happening in real time.
Our YouTube videos can be viewed by clicking Community at the top of our homepage to find the channel link. We posted a new YouTube video tonight discussing major indices as well as some individual stocks, so check it out!
Join our livestream by clicking the link on our homepage every day around 10:30am ET, and you can replay the most recent one any time before the next one begins. We also post a link in Discord when we’re ready to start.
We now have a live demo on our homepage for those who want to explore the main sections of our website, so we invite non-members to check it out!
Thanks for being part of our community and know that we invite and appreciate your feedback!
The information provided by Geeks of Finance LLC is for educational purposes only and is not intended to be, nor should be construed as, an offer, recommendation or solicitation to buy or sell any security or instrument or to participate in any transaction or activity. Please view our Investment Adviser Disclaimer and Risk Disclosure.