Our primary scenarios largely played out from yesterday, though the VIX retest stopped shy of 17 and SPX couldn’t make it past 7644, so the turning points were more bearish in nature. With AAPL down after hours and the election Tuesday evening, will we see volatility leading up to the election, or only afterward? Regardless, let’s look at the levels that we view as catalysts for larger moves in either direction as we tactically address the uncertainties ahead.
Interested in getting access to our tools, trades, and our most active Discord channels? Save $300 off of the annual Portfolio Manager plan with code PUMPKIN300 at checkout!
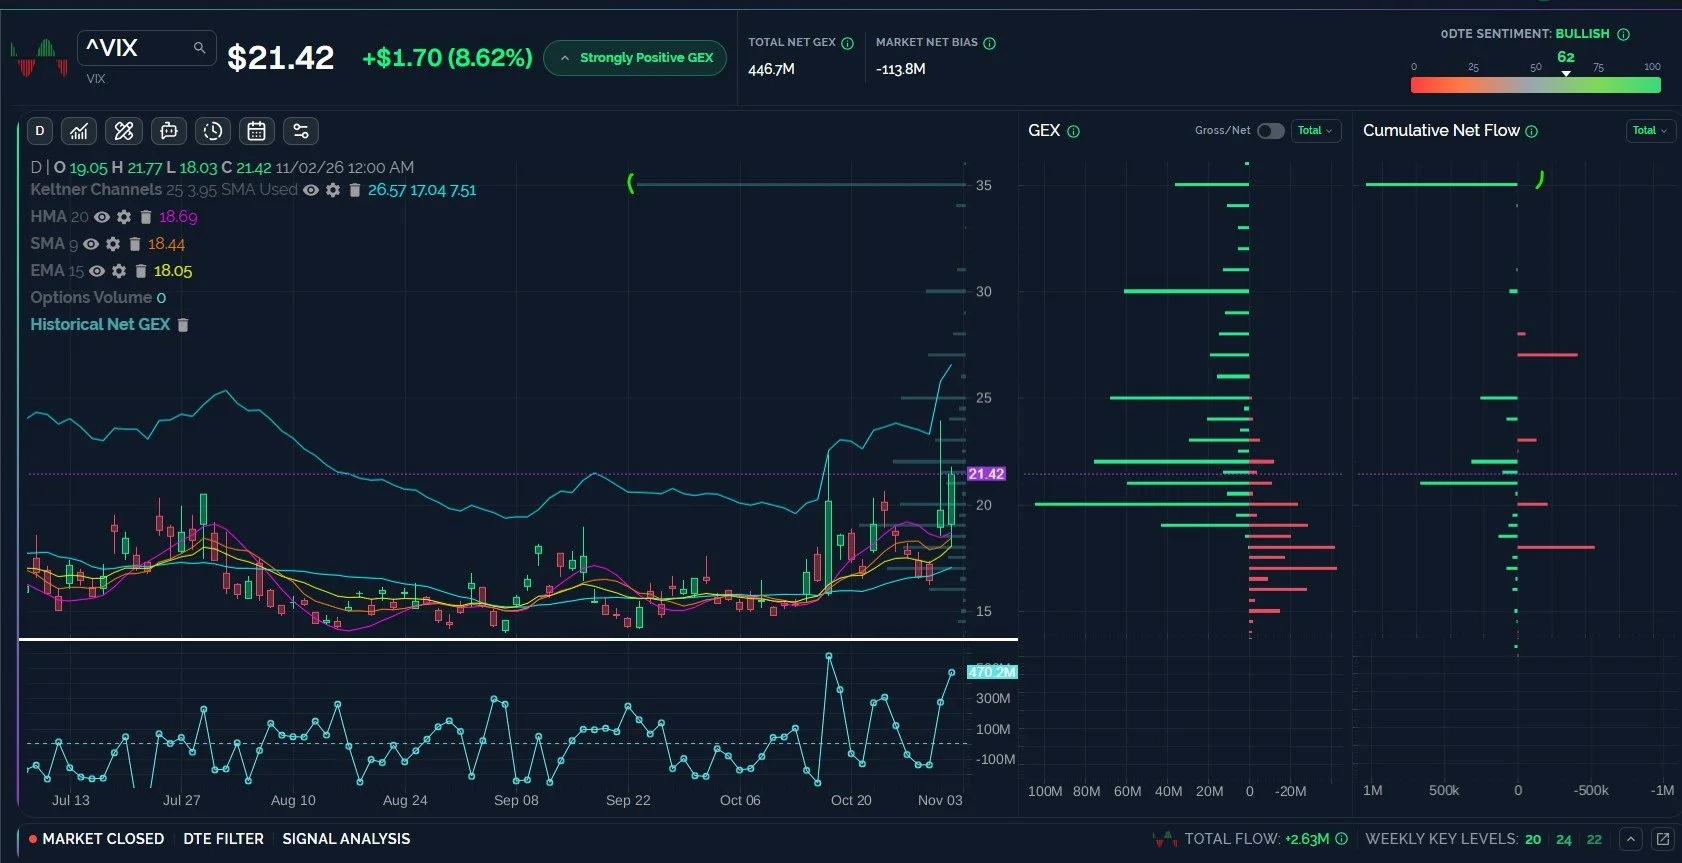
The VIX has the Highest Close Since June 10, Risks a Move to 30+
While the VIX did not make a higher high intraday, the VIX did close at the highest level since June 10. We also had a lower low than Friday, interestingly. Does the higher close imply more upside for volatility, or is the divergence of the intraday high and the lower low implying the spike is done? We’ll all know soon enough, but for now, we will tactically watch the 19-20 zone as a pivot zone, with a larger VIX drop on the table below 19. Bullish (for the VIX) volume at 35 was elevated today, and we see GEX all the way up to 35, so we’ll view any move beyond 22 very cautiously due to the risk of a quick spike toward higher highs.
-Primary scenario: The VIX reaches 25-30, potentially marking a short-term top for the VIX.
-Alternative scenario: The VIX backtests 20, potentially down to 19, then rebounds toward a high at 25+.
Key Levels: Bullish above 22 targeting 25, then 30. Bearish below 19 targeting 17.
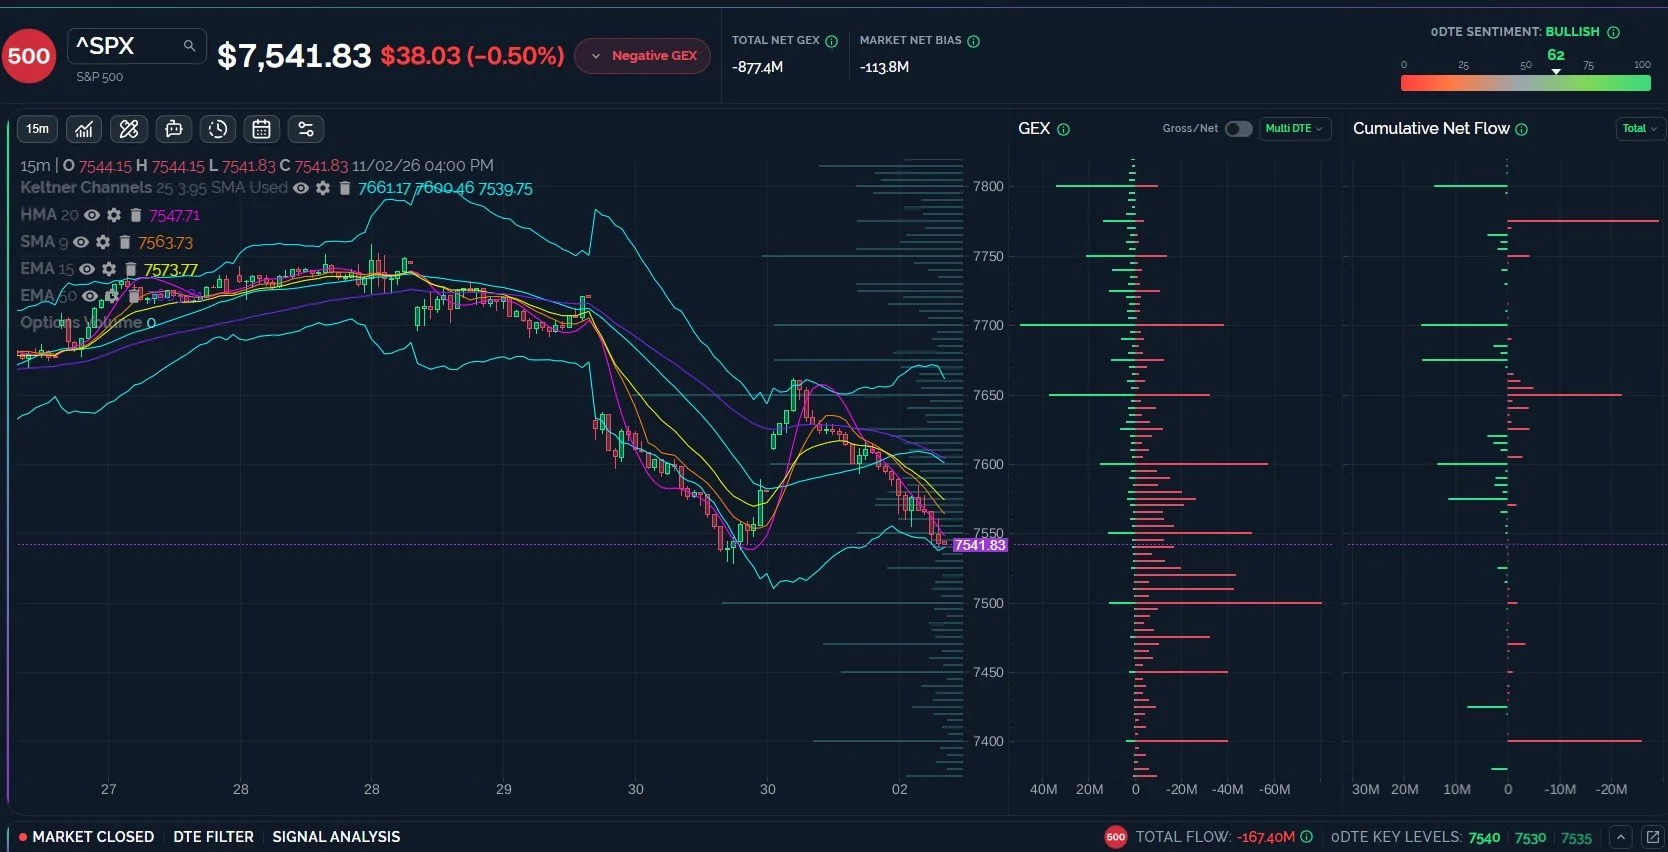
SPX Lower Timeframes Suggest Bounce Potential, 7600 First Target
Lower timeframes such as the 15-minute and 30-minute charts show potential for a bounce based on the Keltner channels and the HMA nearing the lower channel, but higher timeframes still suggest more downside is likely, even if only for a brief intraday period. GEX is spread across a wide range, with negative GEX at 7400 marking the last notable net negative GEX cluster and 7800 visible at the current upper end of the positive side. Most of the net GEX is situated between 7400 and 7600.
Any snapback rally that retests resistance anywhere between 7600-7700 will be watched closely for signs of continuation or reversal, since that zone is an important one for bulls to conquer.
-Primary scenario: SPX retests 7600, then drops to 7500.
-Secondary Scenario: SPX gaps down to 7500, then rebounds toward 7600.
Key Levels: Bullish above 7550 targeting 7600, 7650. Bearish below 7550 targeting 7500, 7450.
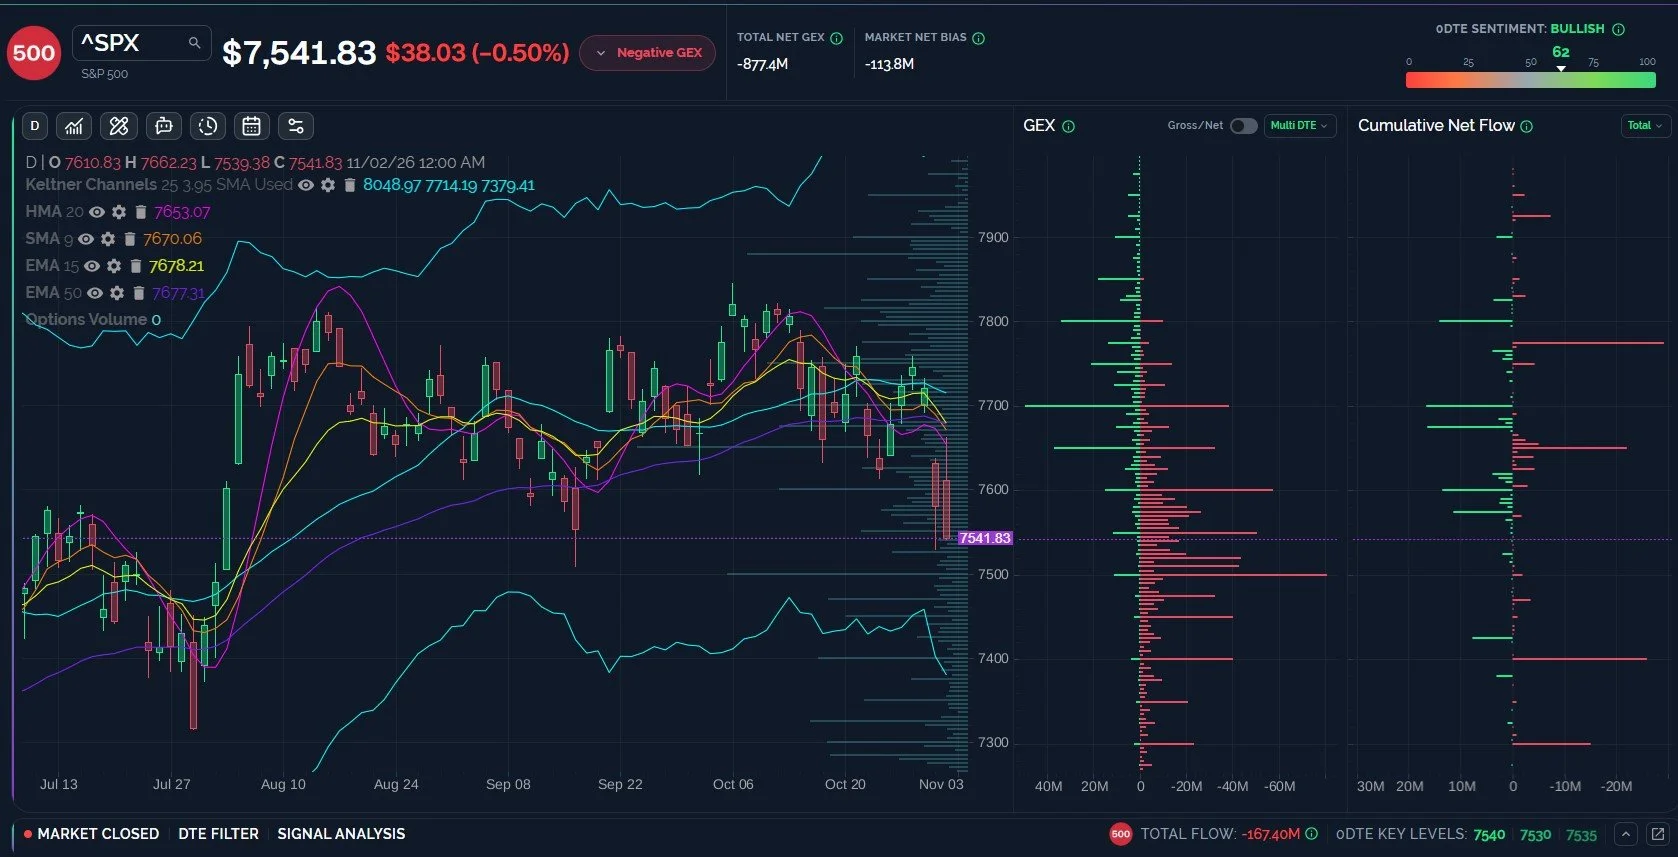
SPX Daily Suggests 7400-7500 POtential Bottom, Intermittent Bounce Due
Let’s briefly look at the daily timeframe for additional context to the levels mentioned above: The lower Keltner channel is fairly close to the large negative GEX cluster we see at 7400, which I view as a realistic extreme (a subjective and relative term) target that should see some consolidation and/or meaningful bounce. GEX gives us the 7500 as another potential reversal target, especially given that 7500 is larger than any other net GEX cluster at the moment. I also note the 7510 and 7520 GEX clusters, effectively creating a thick wall of negative GEX between 7500-7520 that may slow an attempted decline below 7500. If we gap below 7500 overnight or slice through it during the cash session, the move toward 7400 may be swift, given the importance of the 7500-7520 zone.
From a bullish perspective, the distance between SPX price and the HMA is quite wide, so even a temporary bounce from here or lower is highly likely in the near-term, in my view.
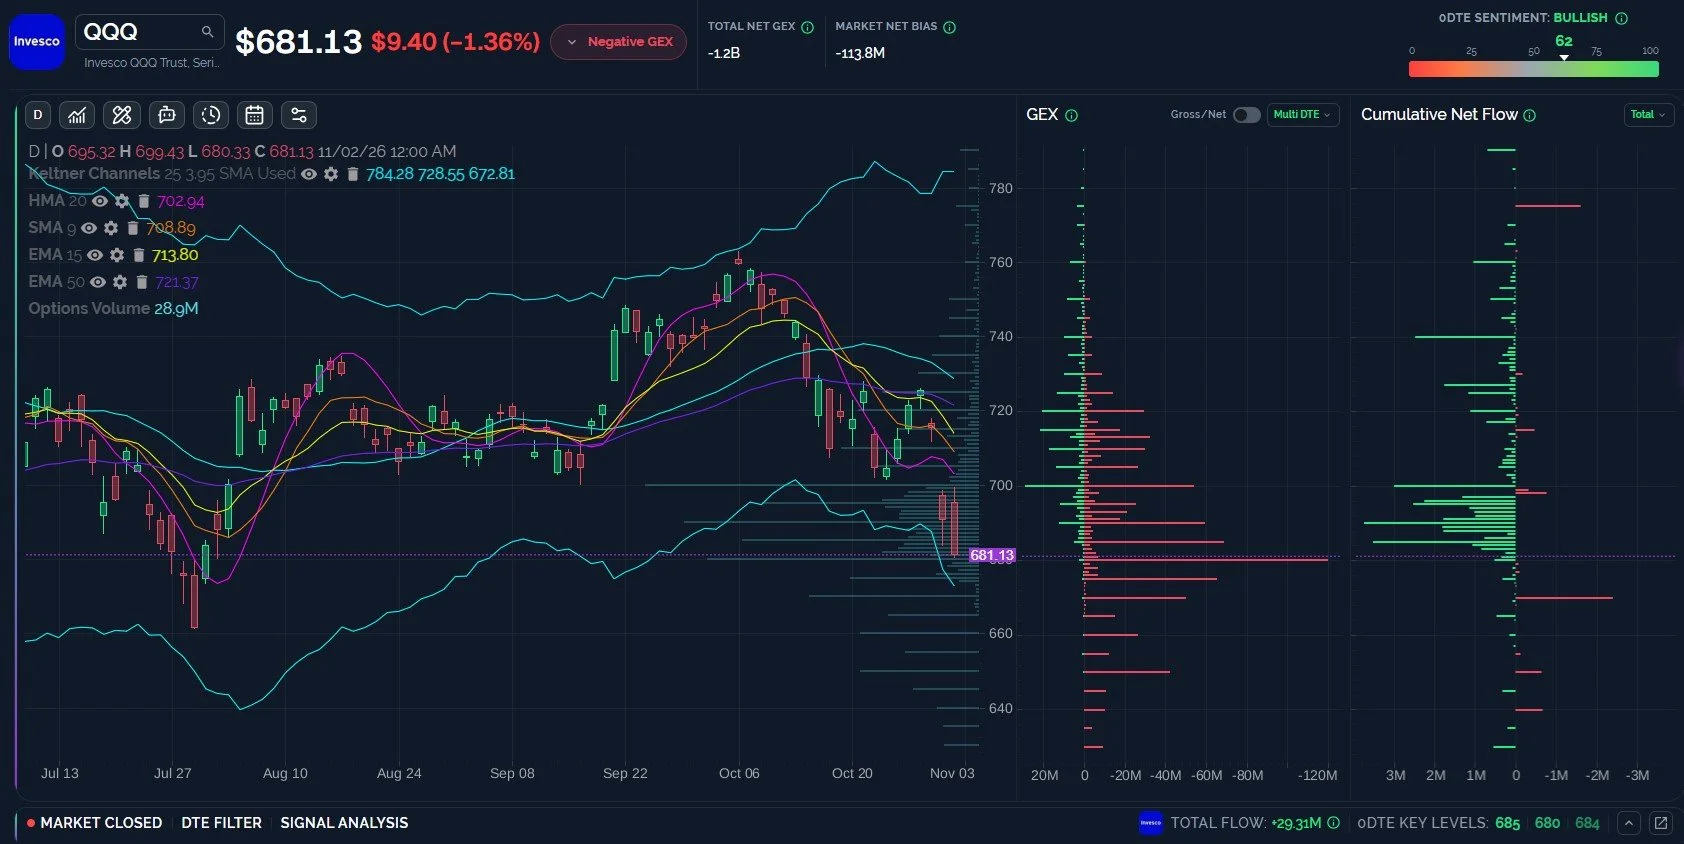
QQQ can Bounce from 670-680, 700 Retest is Important
QQQ price action has been negative for long enough that the Keltner channels are starting to get dragged to the downside, which is not a good look, in my view. The potential implication is that QQQ may be at the front end of a more sustained downtrend targeting 650. Within the current downtrend, a bounce back to the HMA appears likely, which would equate to a retest of 700. Given the additional moving averages between 700 and 720 that would need to be recaptured, QQQ bulls have some work to do to overcome current momentum. Tactically, I am either awaiting a more extreme downside move for a larger contrarian long entry or a recapture of 700, whichever comes first.
-Primary scenario: QQQ tags the 50-day EMA around 670, then bounces for a 700 retest.
-Secondary Scenario: QQQ retests 700, then drops toward 670.
Key Levels: Bullish above 700 targeting 720. Bearish below 700 targeting 670, 660.
Join The Discussion
Non-subscribers can join our great Discord community with all of its experienced traders by clicking Community on our homepage. First-time guests get a free 7-day trial of the premium Discord channels, where we talk through what is happening in real time.
Our YouTube videos can be viewed by clicking Community at the top of our homepage to find the channel link. We posted a new YouTube video tonight discussing major indices as well as some individual stocks, so check it out!
Join our livestream by clicking the link on our homepage every day around 10:30am ET, and you can replay the most recent one any time before the next one begins. We also post a link in Discord when we’re ready to start.
We now have a live demo on our homepage for those who want to explore the main sections of our website, so we invite non-members to check it out!
Thanks for being part of our community and know that we invite and appreciate your feedback!
The information provided by Geeks of Finance LLC is for educational purposes only and is not intended to be, nor should be construed as, an offer, recommendation or solicitation to buy or sell any security or instrument or to participate in any transaction or activity. Please view our Investment Adviser Disclaimer and Risk Disclosure.