Our primary scenarios in last night’s newsletter were directionally spot on, though the unpredictable magnitude of Thursday’s drop was a sight to see. Friday’s range remains a wildcard, though we can assign very broad parameters to a likely trading range, and we’ll take a look at some contrarian indicators that have consistently marked bottoms within 2 days. A rally is right around the corner (most likely), but what happens after a bounce?
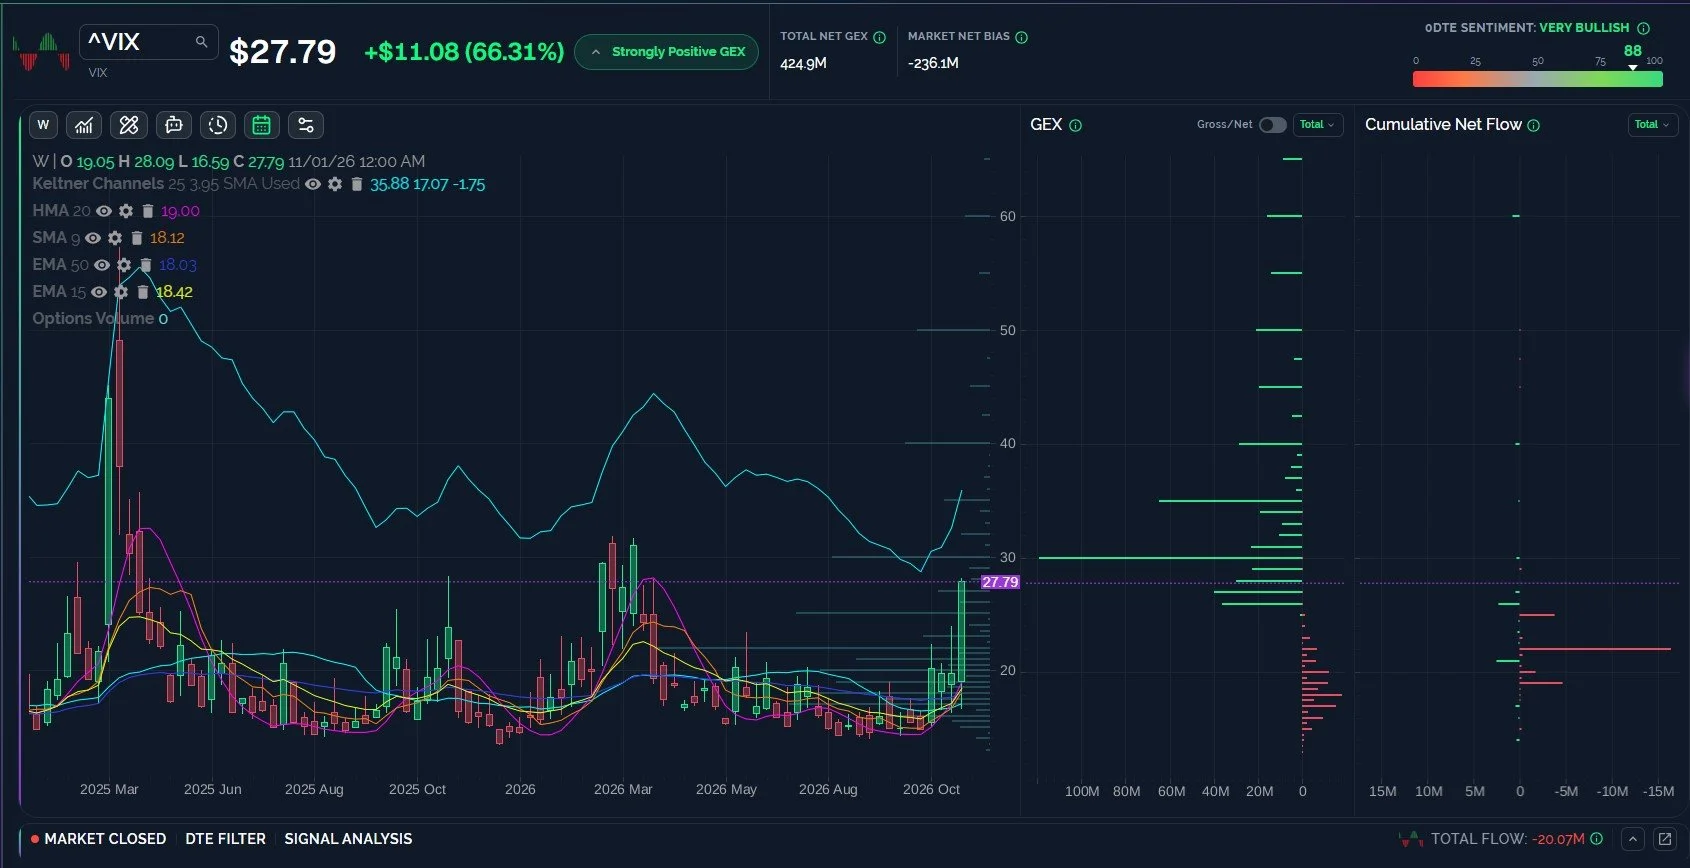
The VIX GEX Suggests 30-35 is Likely as of Thursday’s Close
I can’t think of anything that involves more guessing than trying to pinpoint the top of a VIX spike, but we can have some broad estimates in mind with the usual caveat that the VIX might not spike further from here. If we do see the VIX continue higher, which appears to have good odds in the very short run, we see large positive GEX cluster at the 30 and 35 strikes. The upper Keltner channel on the weekly chart is now 35.88, so there’s some indicator confluence for you. Curiously, today we see virtually no cumulative net option flow and light volume at 35, though activity at the 30-strike is more noteworthy. Volume was highest at the 22-strike launchpad that set the momentum for the move to today’s high above 28. I want to see 19 lost to signal that the fun and games for the bears might be over, but until then, we have risk of a larger drop in indices. Immediate momentum is likely as long as the VIX is above 26.
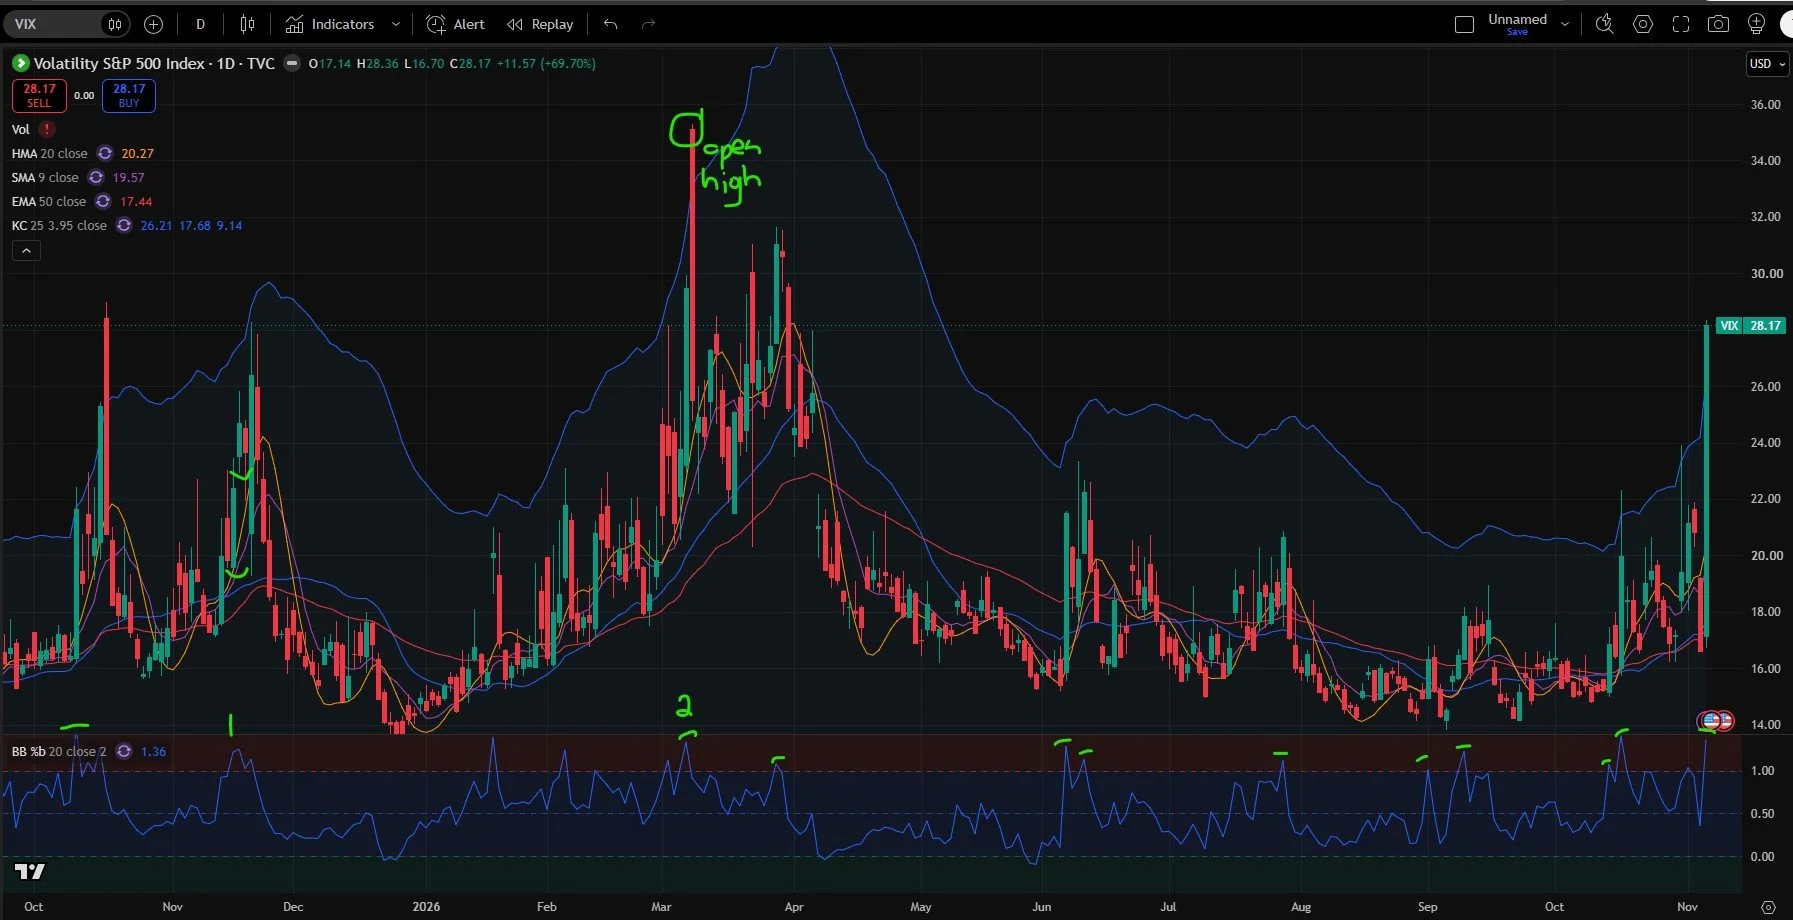
One Indicator has Consistenly Marked VIX tops; Exceptions Exist
Let’s zoom in to the daily chart with the percentage bollinger (%b 20,2) indicator along the bottom. The signs are encouraging for bulls: Virtually every time we see the VIX cause the %b indicator to spike above 1.0, we have a VIX top. This is true for almost every instance visible on the screenshot below.
Two exceptions:
1) November 2025- we saw one additional day with the VIX gapping up and closing higher.
2) March 2026- Day 2 saw a much higher opening VIX, but the VIX faded all day, so the reading never spiked beyond the prior day’s %b reading.
My conclusion is that the VIX spike can result in a higher VIX Friday, maybe Monday, but statistically, the VIX is going to enter uncharted territory if it keeps running with the reading we have now. All we can do is base our trades on the odds and have our risk parameters in place, and in this case, the odds seem to favor that a great buying opportunity is right around the corner for indices. I know, that sounds like the end of the newsletter, but I’m going to keep going..Like the commercial you wish would just end.
-Primary scenario: The VIX reaches 30+ early in the morning or leading into the cash session before beginning a big drop, allowing indices to bounce.
-Secondary Scenario: The VIX starts out the day below 25, then rebounds to start the final leg of the current market decline, reaching 35+ toward the end of the day Friday.
Key Levels: Bullish for volatility above 26 targeting 30-35. Bearish below 19 targeting 16-17.
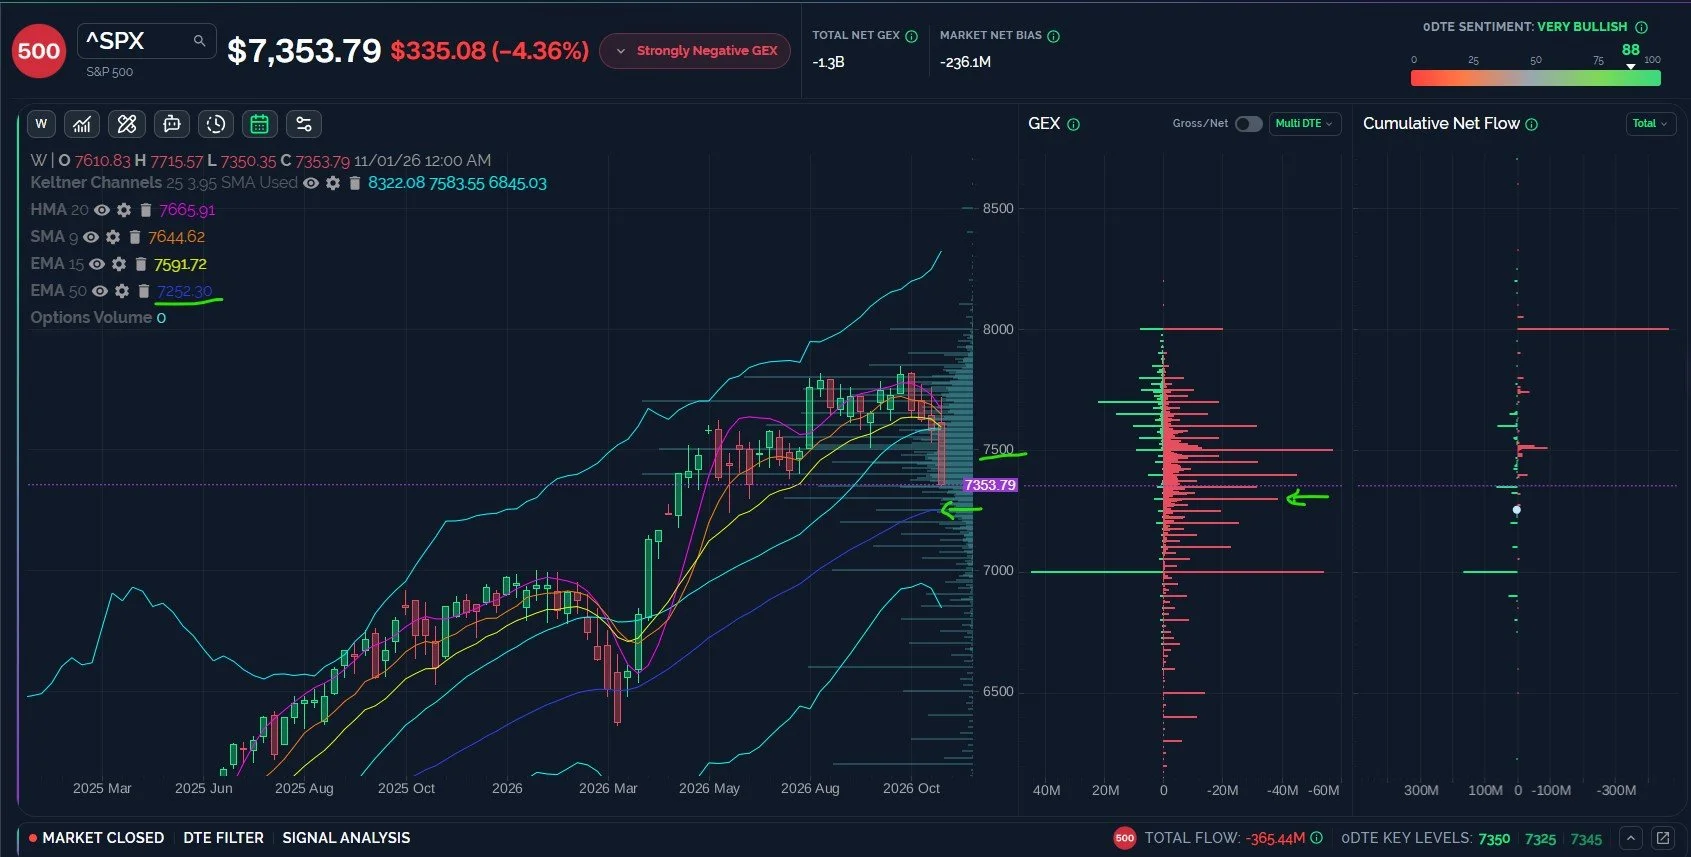
SPX Hasn’t Even Tagged the Weekly 50-EMA Yet, Another 100 Points Lower?
While QQQ tagged its weekly 50-EMA Thursday, SPX hasn’t yet tagged its own 50-EMA, which is currently at 7252. Looking at the GEX picture, we have meaningful negative GEX clusters all the way down to 7000, a change in character from what we’ve seen in prior days. A number of factors make a straight-line tag of 7000 a low probability, and 7300 currently represents the next best shot for the market to rebound. With the 50-EMA less than 50 points lower than 7300, an overshoot and then a daily close back above 7300 would be enough to convince me that a rebound is ahead. Alternatively, there’s no rule that says SPX has to reach 7252, so we could see a rebound immediately. SPX is stretched far below the daily and weekly HMA and we also see the percentage bollinger indicator at stretched readings typically associated with market bounces.
-Primary scenario: SPX drops to somewhere between 7250-7300 and begins a powerful rebound toward 7500, even if temporary.
-Secondary Scenario: SPX opens up somewhere between 7379-7450, then drops toward 7250-7300.
Key Levels: Bullish above 7379 targeting 7450, then 7500. Bearish below 7379 targeting 7300.
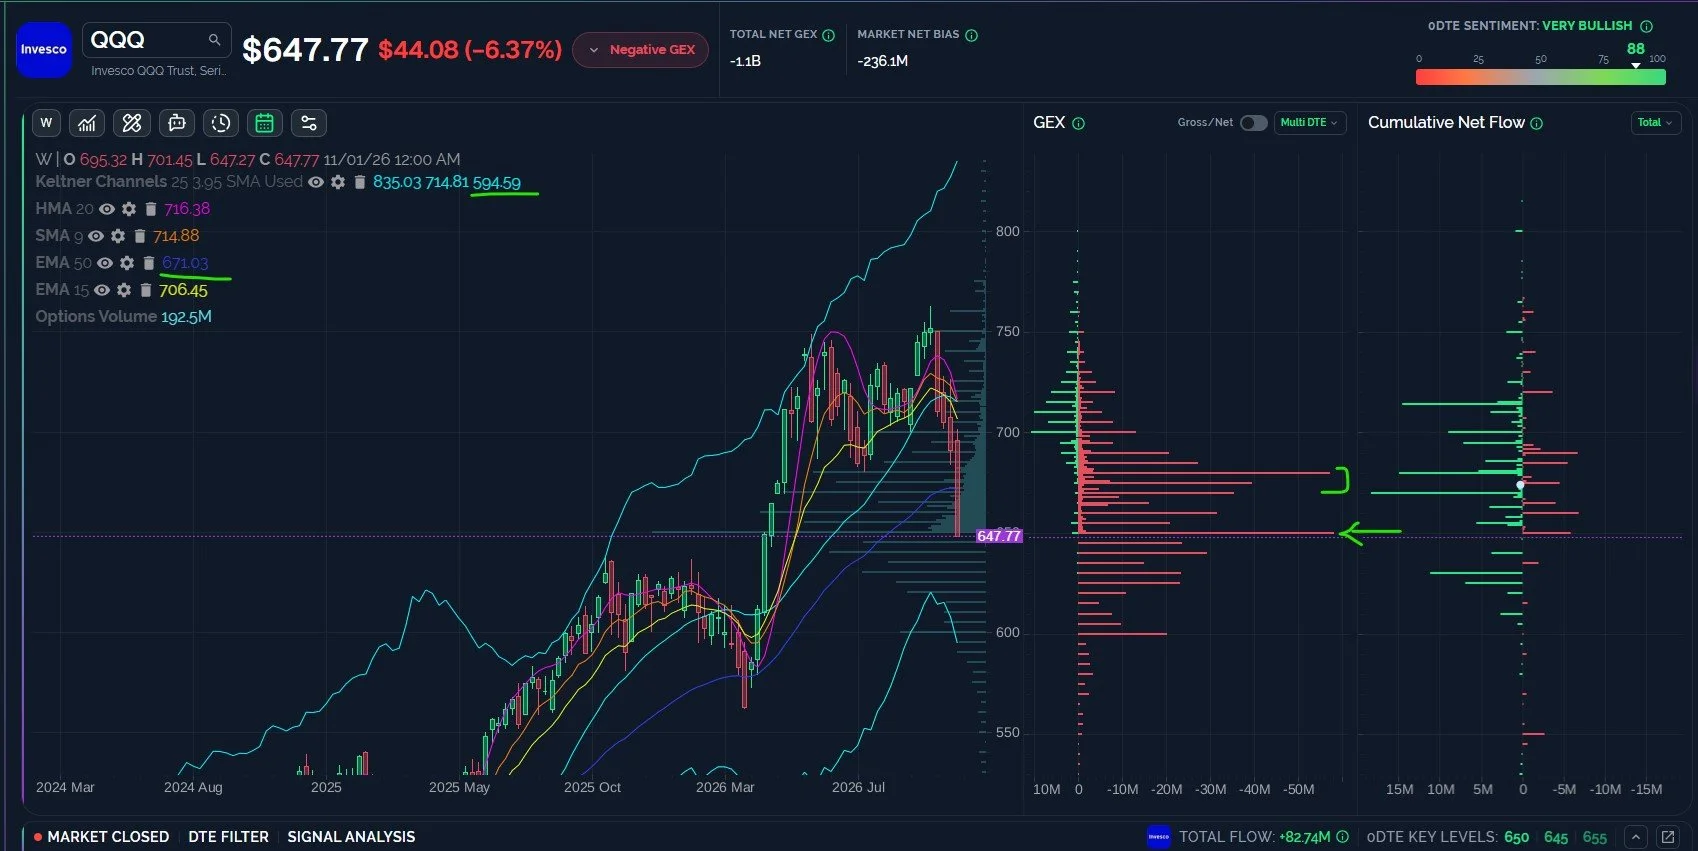
QQQ has Risk to 600, 650-675 is a big GEX Area with Positive Option Flow
QQQ is already farther below the 50-EMA than any time since April 2025, and QQQ is close enough to the big GEX cluster at 650 to be justified in rallying. We also see significant positive flow between 670-714. GEX and the positive flow at 630 suggests we might see the decline reverse at that point, if the drop keeps going. Ultimately, 600 aligns with the lower weekly Keltner channel and serves as the last area we’ll watch closely if we see a continued outlier with the magnitude of the decline. With semis beaten up and defensive stocks likely proving to be more of a headwind for SPX in the event of a market rebound, QQQ may flip back to being in the lead in a rebound scenario.
-Primary scenario: QQQ drops to 630, then rebounds to retest 680.
-Secondary Scenario: QQQ drops toward 600 (given today’s close below 650), then immediately begins a strong intraday bounce going into the weekend.
Key Levels: Bullish above 650 targeting 680-700. Bearish below 650 targeting 600.
Join The Discussion
Non-subscribers can join our great Discord community with all of its experienced traders by clicking Community on our homepage. First-time guests get a free 7-day trial of the premium Discord channels, where we talk through what is happening in real time.
Our YouTube videos can be viewed by clicking Community at the top of our homepage to find the channel link. We posted a new YouTube video tonight discussing the market carnage, so check it out!
Join our livestream by clicking the link on our homepage every day around 10:30am ET, and you can replay the most recent one any time before the next one begins. We also post a link in Discord when we’re ready to start.
We now have a live demo on our homepage for those who want to explore the main sections of our website, so we invite non-members to check it out!
Thanks for being part of our community and know that we invite and appreciate your feedback!
The information provided by Geeks of Finance LLC is for educational purposes only and is not intended to be, nor should be construed as, an offer, recommendation or solicitation to buy or sell any security or instrument or to participate in any transaction or activity. Please view our Investment Adviser Disclaimer and Risk Disclosure.