
FOMC And Earnings: Volatile Week Ahead?
SPX rallied Friday, only to give up virtually the entire rally, closing not far from Thursday’s gap down some 90 points below Wednesday’s close. Friday’s close was below key daily and weekly support according to my indicators, yet we see a relief bounce in process during the overnight session. With big tech earnings this week and the FOMC announcement Wednesday, we may see more volatility, with GEX indicating SPX 7300 has good odds of being reached, yet a backtest of the 7500+ area is also completely within reason. Now that we’ve “played” both sides, let’s take a look at the GEX picture and some key levels that may trigger a move in either direction.
Members save $300 on the annual Portfolio Manager plan with code SUMMER26 at checkout, which will run a few more days.
SPX’s Weekly Picture Gives 7339 and 7464 As The Closest Important Levels
Our weekly candlestick chart below shows total gross GEX at each strike immediately to the right of the chart, and cumulative net option flow is along the far-right edge of the page. We see negative flow at 8000 and positive flow at 7000, a theme I’ve noticed multiple times last week. Looking at more relevant areas (by virtue of their proximity to SPX’s price currently), we see most of the GEX between 7300-7600, with 7500 and 7600 representing the largest gross GEX strikes outside of 7000 and 8000. The significance of the 7464-7500 zone may bring a lot of attention to the area this week, but we need to first see if SPX can hold above 7400, since the 9 SMA at 7339 is just below, and 7300 is the largest net GEX cluster across any timeframe (not shown, but members can see for themselves by toggling gross/net on the Total GEX setting).SPX retaking the 9 SMA at 7464 potentially opens the door to 7500 and then 7587, the weekly HMA.
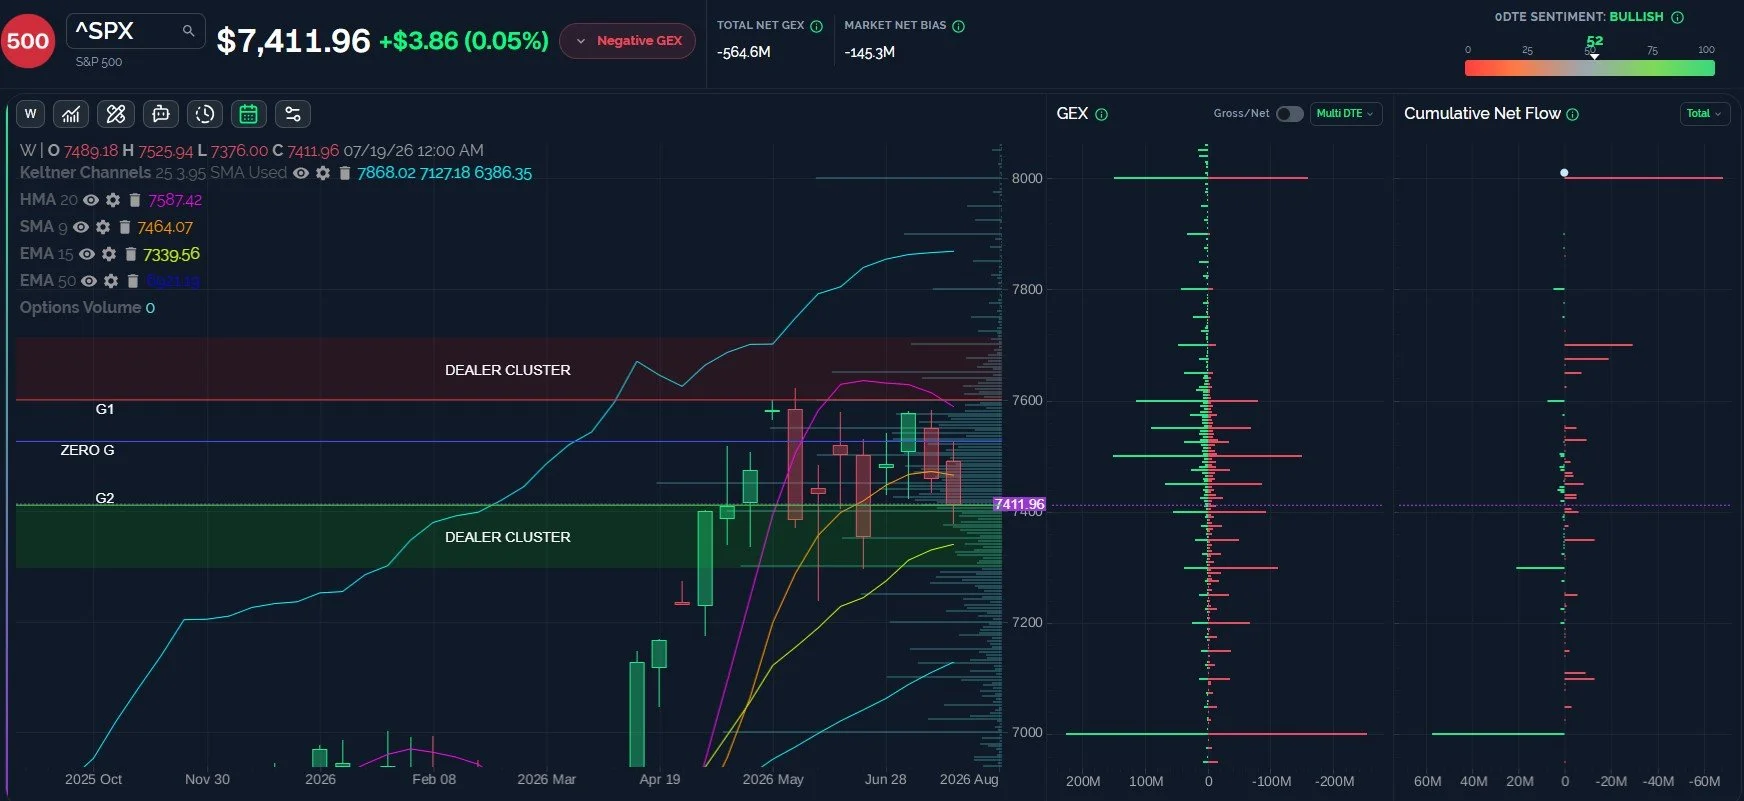
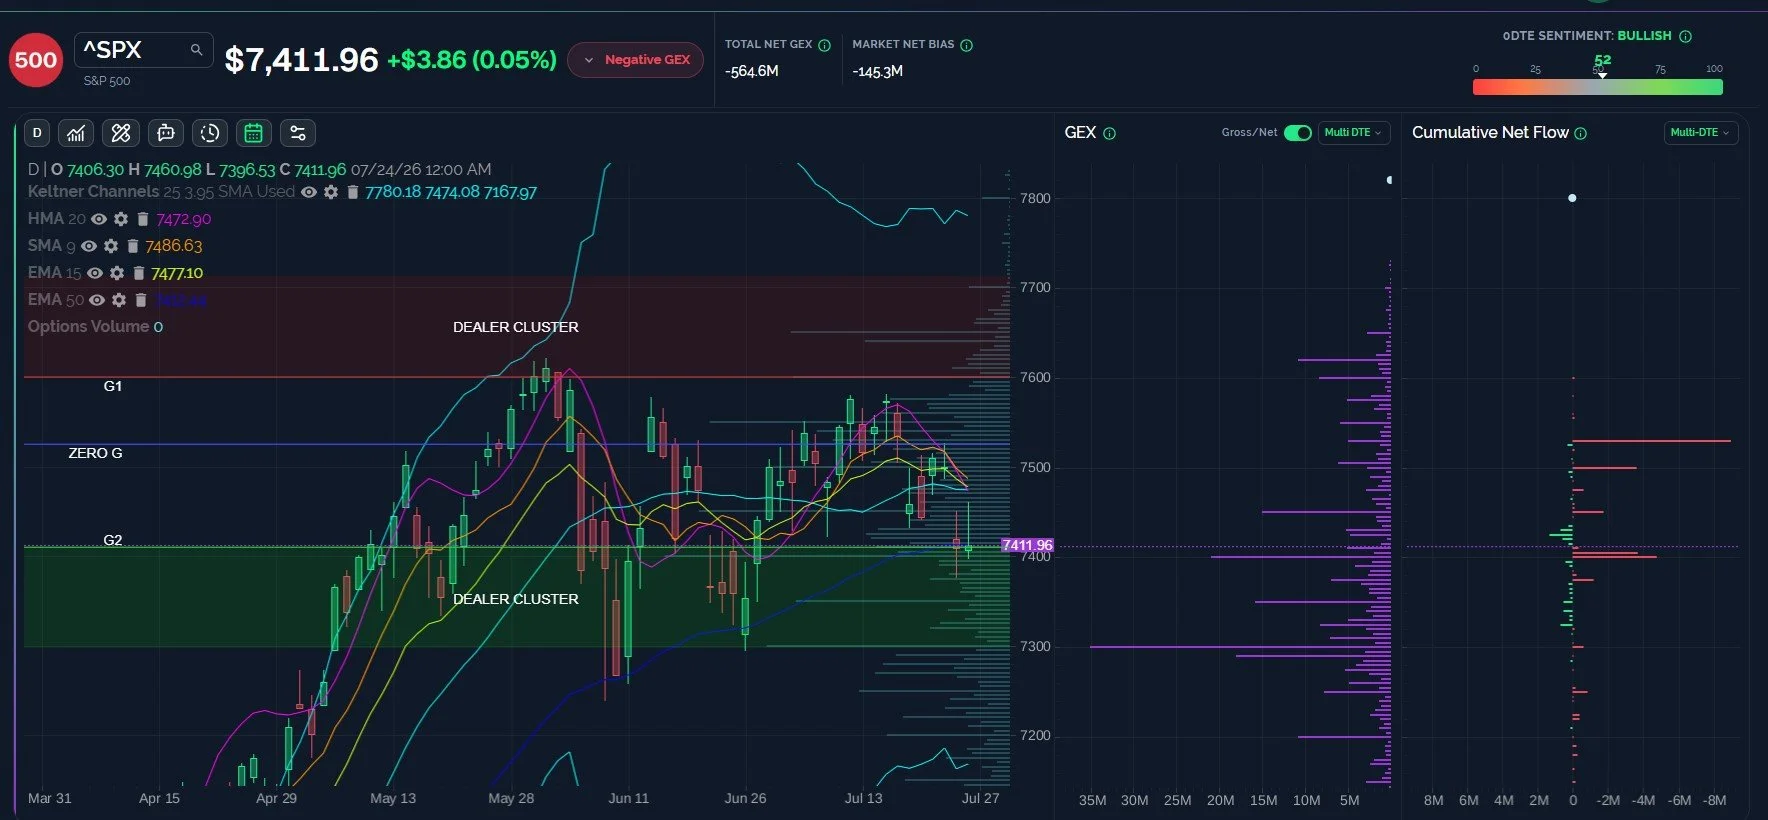
SPX Daily Also Shows 7300 As The Largest Net GEX Cluster
Ignoring futures at the moment, which look quite positive, Friday’s close was not a good look on the weekly or daily timeframes. Looking at the daily chart below, SPX closed well below the daily HMA, which is currently within a tight cluster of other moving averages between 7474-7487 (not far from the 7464 mentioned on the weekly chart). We may see any gap up tomorrow fade unless we can see 7464-7487 captured and converted to support, with a daily close above 7500 looking quite bullish. Any touch of 7300 this week may present a good buying opportunity, if the current GEX picture remains, showing important support and GEX at 7300-7339.
Key levels: Bullish above 7464 targeting 7487, 7500, 7587. Bearish below 7400 targeting 7339, 7300.
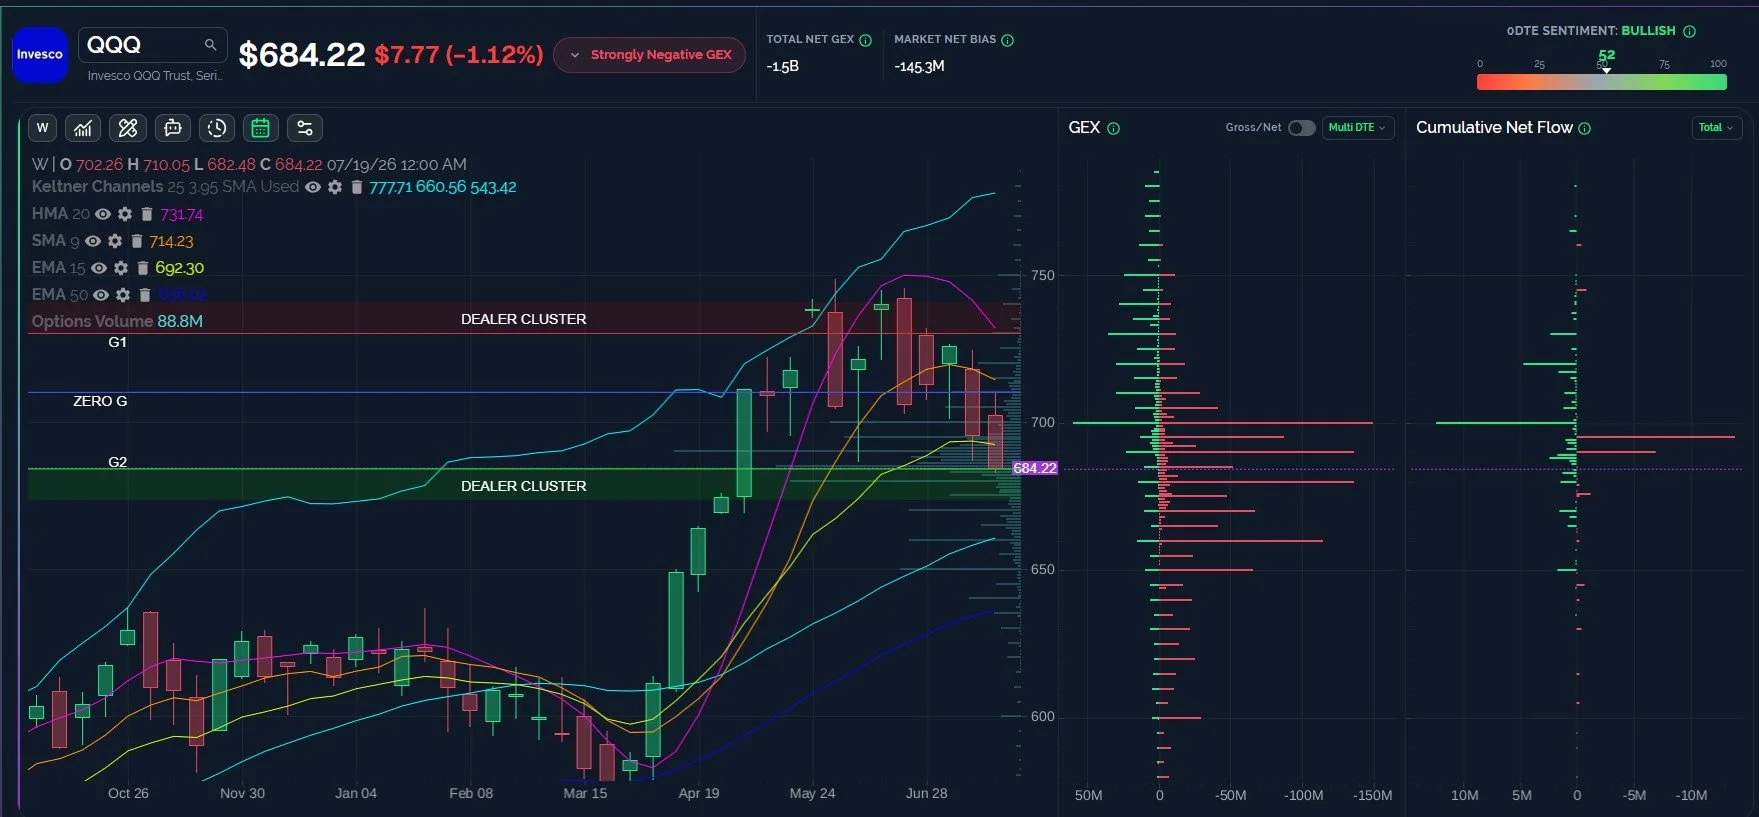
QQQ: 700 Retest May Be Incoming, DOwnside Risk To 660 Remains
GEX looks negative looking to next week, with 660 especially in focus to the downside. QQQ closed below the 15 EMA at 692, leaving the weekly middle Keltner channel at 660.56 as the best alignment with the negative GEX picture. Recapturing 700 opens the door to a test of 714, then 731, though the 9 SMA and HMA associated with those levels is declining. With MSFT, AMZN, META, and AAPL this week, can Mag 7 save the market, or will they act as the catalyst to 660?
Key Levels: Bullish above 700 targeting 714, then 731. Bearish below 680 targeting 660.
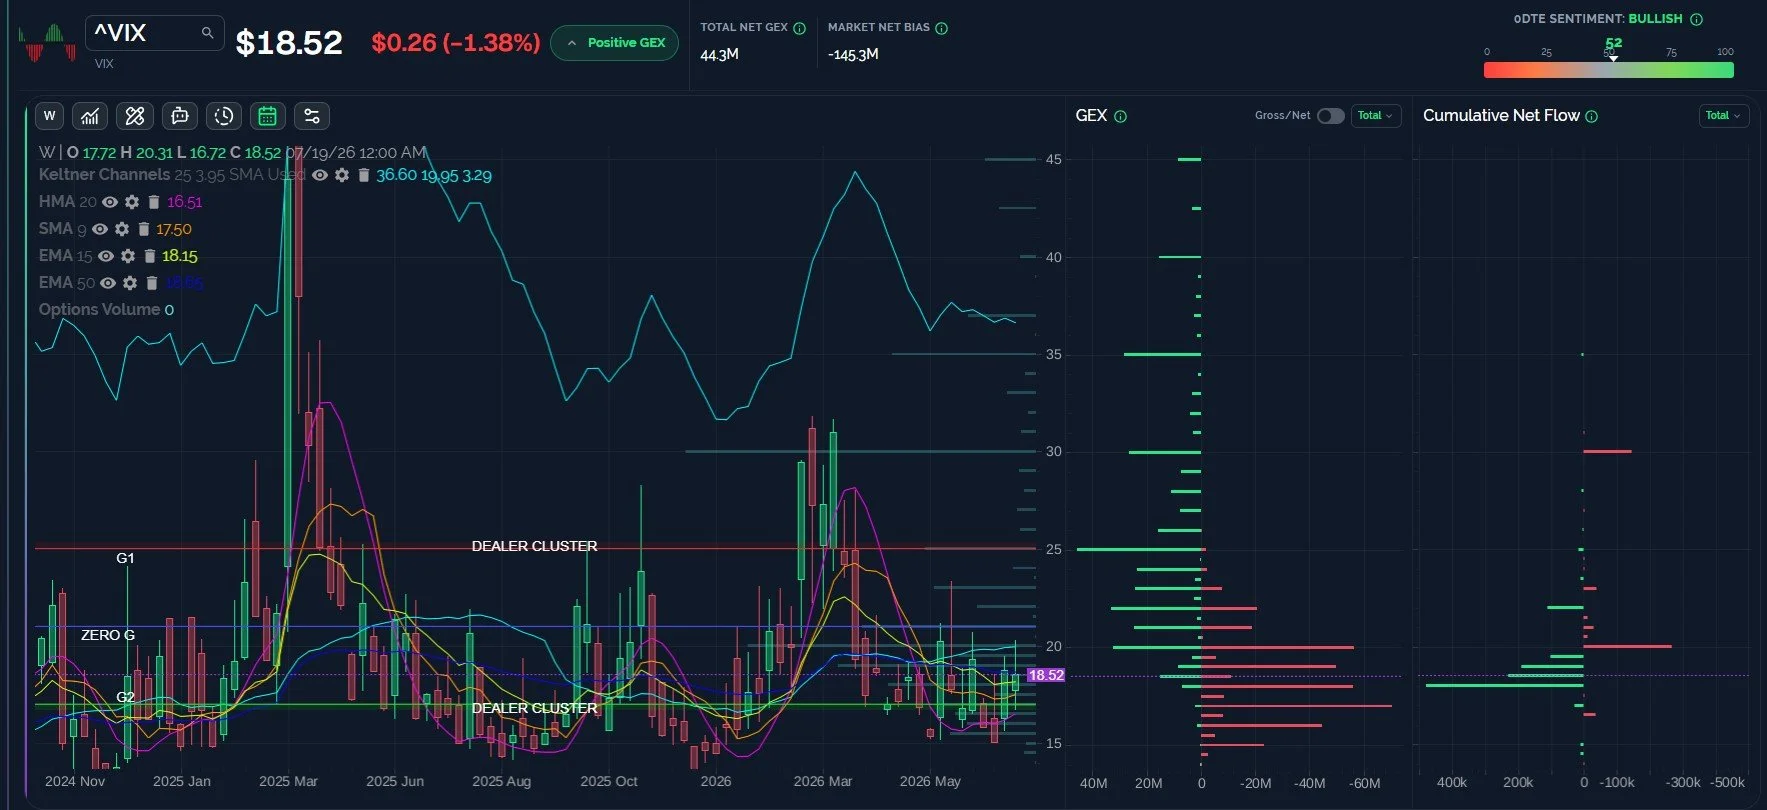
The VIX Maintains A Setup To Spike To 25
The VIX shows potential to reach 17-17.5 on lower timeframes, but the weekly chart gives a lot of room on the downside (all the way to 16.5) without invalidating the VIX having potential to reach 25-30. And we could see the sort of volatility this week that may see a brief visit of that entire range. Big GEX at 20 on both sides appears to be an important line-in-the-sand, keeping a lid on volatility, though a breach of 20 could bring 25 quite quickly.
Key Levels: Bullish above 20 targeting 25, 30. Bearish below 18 targeting 17.5 down to 16.
Join The Discussion
We hope you will join us in Discord this week, where we will share some observations for free. Non-subscribers can join through Community on our homepage. First-time guests get a free 7-day trial of the premium Discord channels, where we talk through what is happening in real time.
We have a NEW YouTube video tonight, covering broader indices and a number of major stocks. View the new video by clicking Community at the top of our homepage to find our YouTube channel link.
Join our livestream by clicking the link on our homepage every day around 10:30am ET, and you can replay the most recent one any time before the next one begins. Our next livestream is today, Monday the 27th.
Thanks for being part of our community and know that we invite and appreciate your feedback!
The information provided by Geeks of Finance LLC is for educational purposes only and is not intended to be, nor should be construed as, an offer, recommendation or solicitation to buy or sell any security or instrument or to participate in any transaction or activity. Please view our Investment Adviser Disclaimer and Risk Disclosure.
