
VIX Upside Scenario Intact, Decision Time
Thursday saw a picture suggesting at least a temporary bounce for indices, which we discussed in Thursday night’s newsletter. We saw a bounce OpEx Friday, and the VIX pulled back to 15.15 by the close. The net GEX picture is positive on a total basis, but this week paints an uncertain near-term picture as we begin the September OpEx cycle.
Members save $300 on the annual Portfolio Manager plan with code SUMMER26 at checkout, which is nearing its end over the next few days.
We also have a new offering for longer-term investors- appropriately named The Investor, featuring valuation analysis, customizable valuation model inputs, and A.I-assisted earnings report data and a lot more, and at a much lower price point than our competitors! Check it out under Pricing, or click Stocks on our homepage demo (link toward the end of the newsletter).
Last Week’s Drop Stopped Right at the HMA, Net GEX Aims for 7900
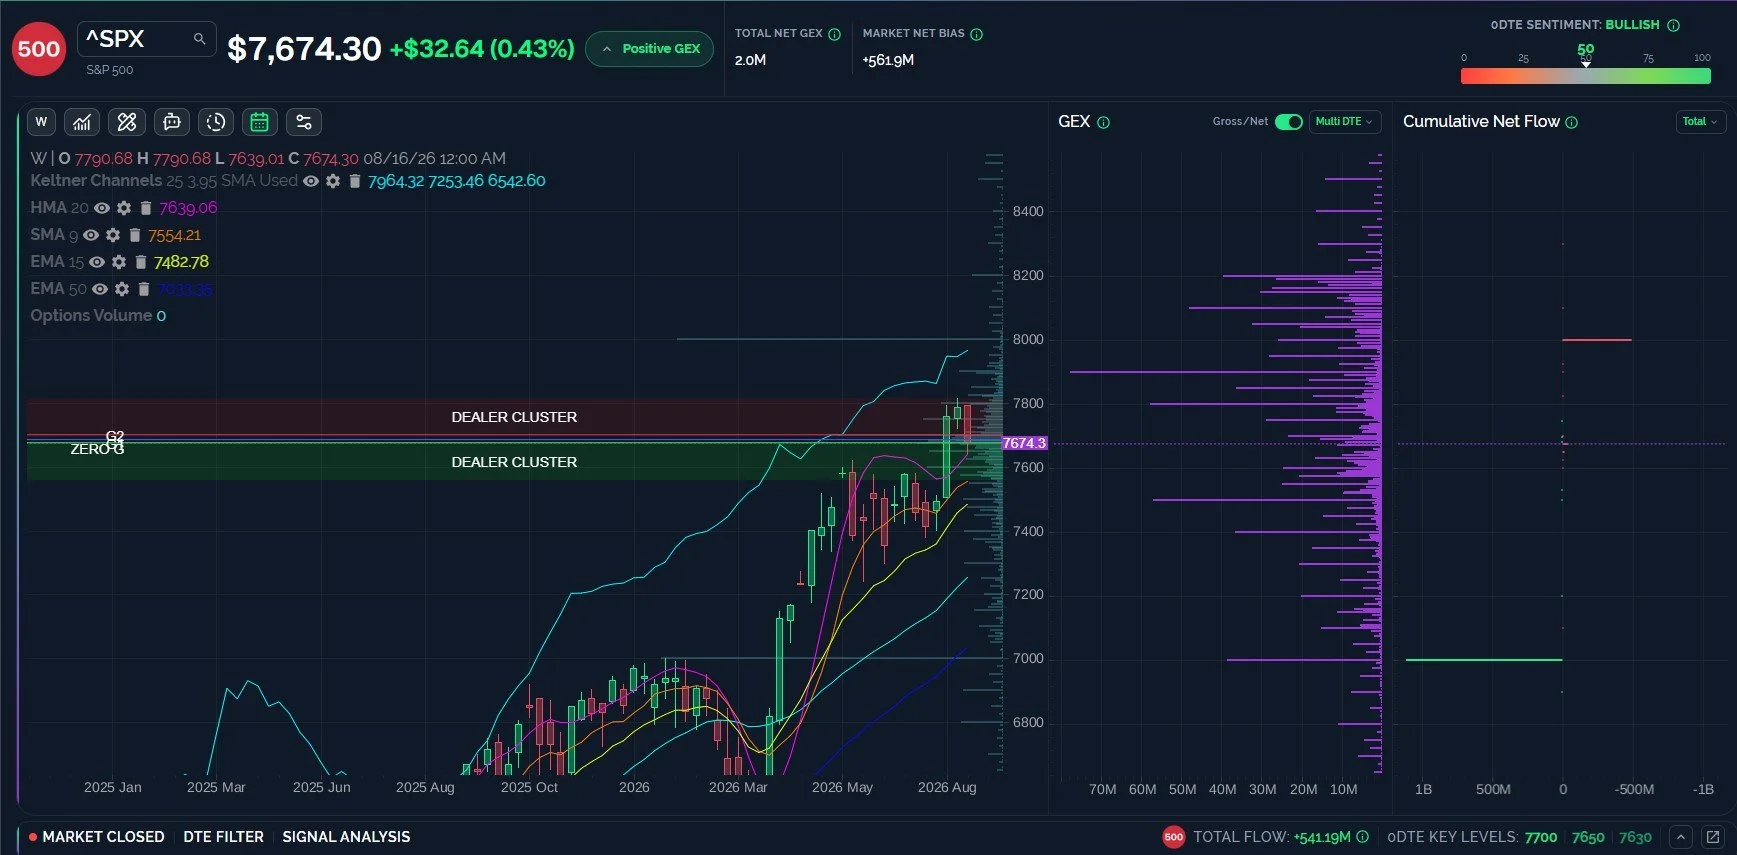
The weekly Keltner channel for SPX looks bullish, still pointing higher with 7964 marking the upper channel boundary. Most of the net GEX on a total timeframe is concentrated between 7500-8100, with the largest net GEX cluster sitting at 7900, a positive GEX cluster. Furthermore, last week’s modest drop stopped right at the weekly HMA at 7639, briefly dipping 0.05 below the current reading. Holding the HMA Looks bullish from our view, with 7800-7900 as potentiall upside targets beyond.
SPX GEX, Daily Chart, Option Flow Suggests Near-Term Caution
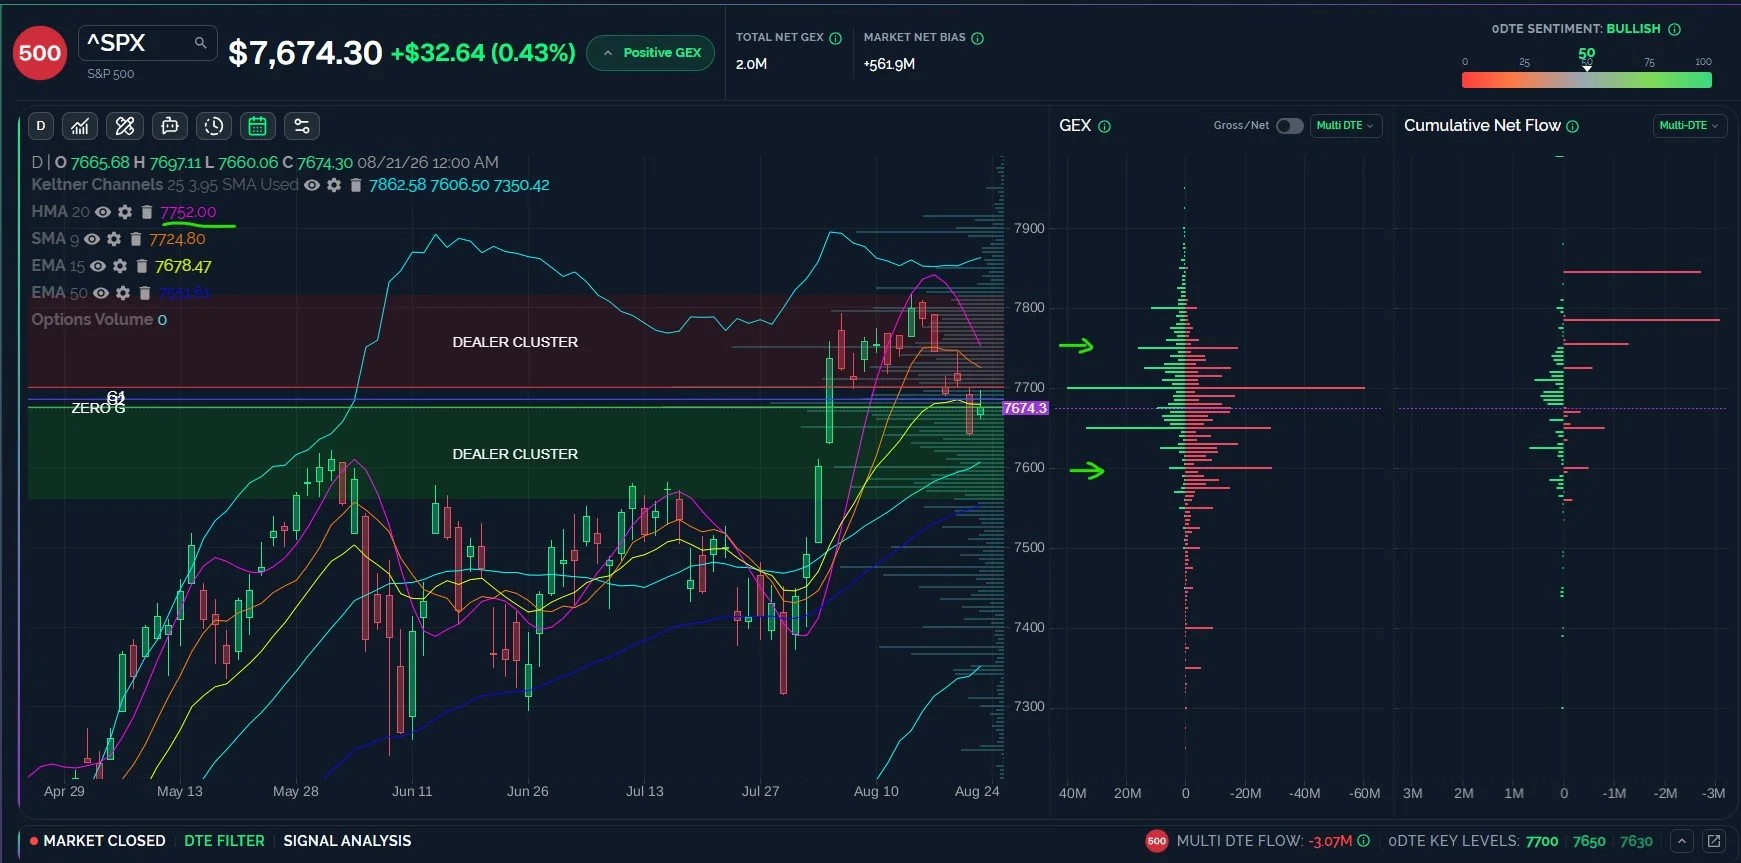
One reason we look at the net GEX and gross GEX pictures is the possibility of a large amount of positive/negative GEX at one level that might be balanced on both sides, not showing up on the net chart, yet representing a large potential support/resistance area. In contrast, we think large net GEX clusters can represent “magnetic” targets in some respects, especially if the large gross GEX clusters are lost or overcome as pivots to accelerate toward those net targets, whether higher or lower.
Looking at this week, we see most of the GEX between a large net negative GEX cluster at 7600 and a “neutral” area of GEX on both sides of the aisle at 7750. 7700 is even bigger, representing an important pivot up or down based on the current GEX picture. The daily HMA is declining and the HMA will meet the 9 SMA near 7720, at the current trajectory. This confluence may be an important upside resistance for SPX, also just above the huge GEX at 7700.
Key Levels: Bullish above 7700 targeting 7750, then 7900. Bearish below 7650 targeting 7600, then 7550.
QQQ Weekly Chart Looks Like 800 Might Ultimately Come Into Focus
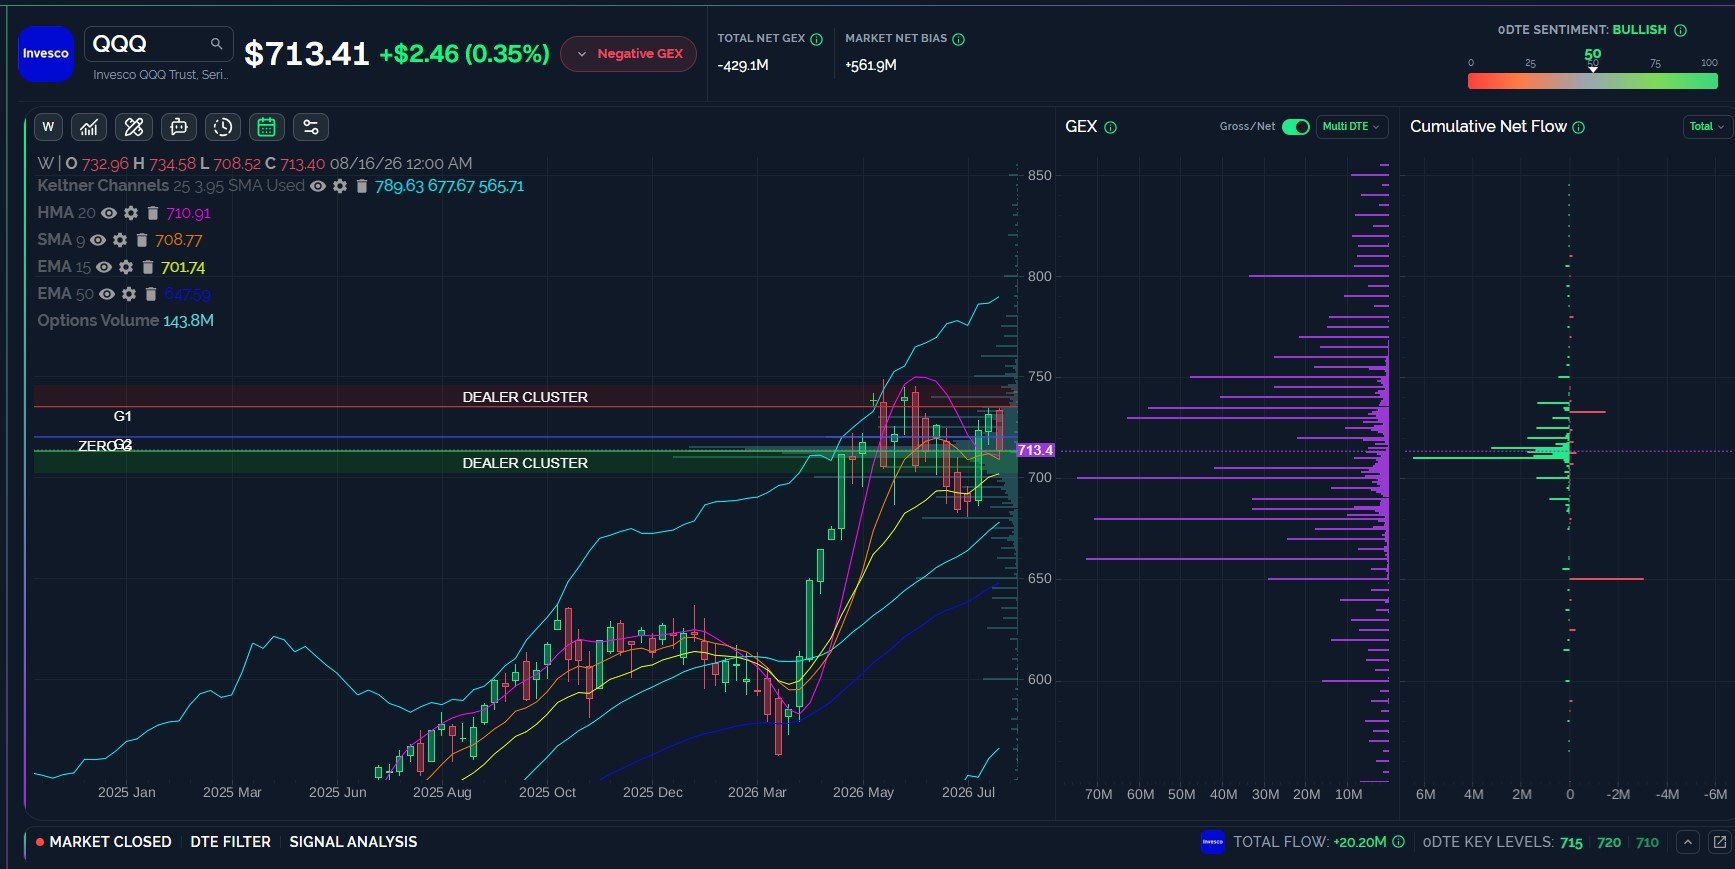
QQQ stopped its decline that the weekly HMA as well, dipping down to the 708 area before bouncing. Net GEX appears clustered mostly from 660-750, with 700-730 looking like the current battleground to decide whether QQQ will head toward 750-800 or a retest of 660, the approximate halfway back destination from the March-May rally.
QQQ This Week Looks Like 735 May Cap Upside- Unless GEX Shifts
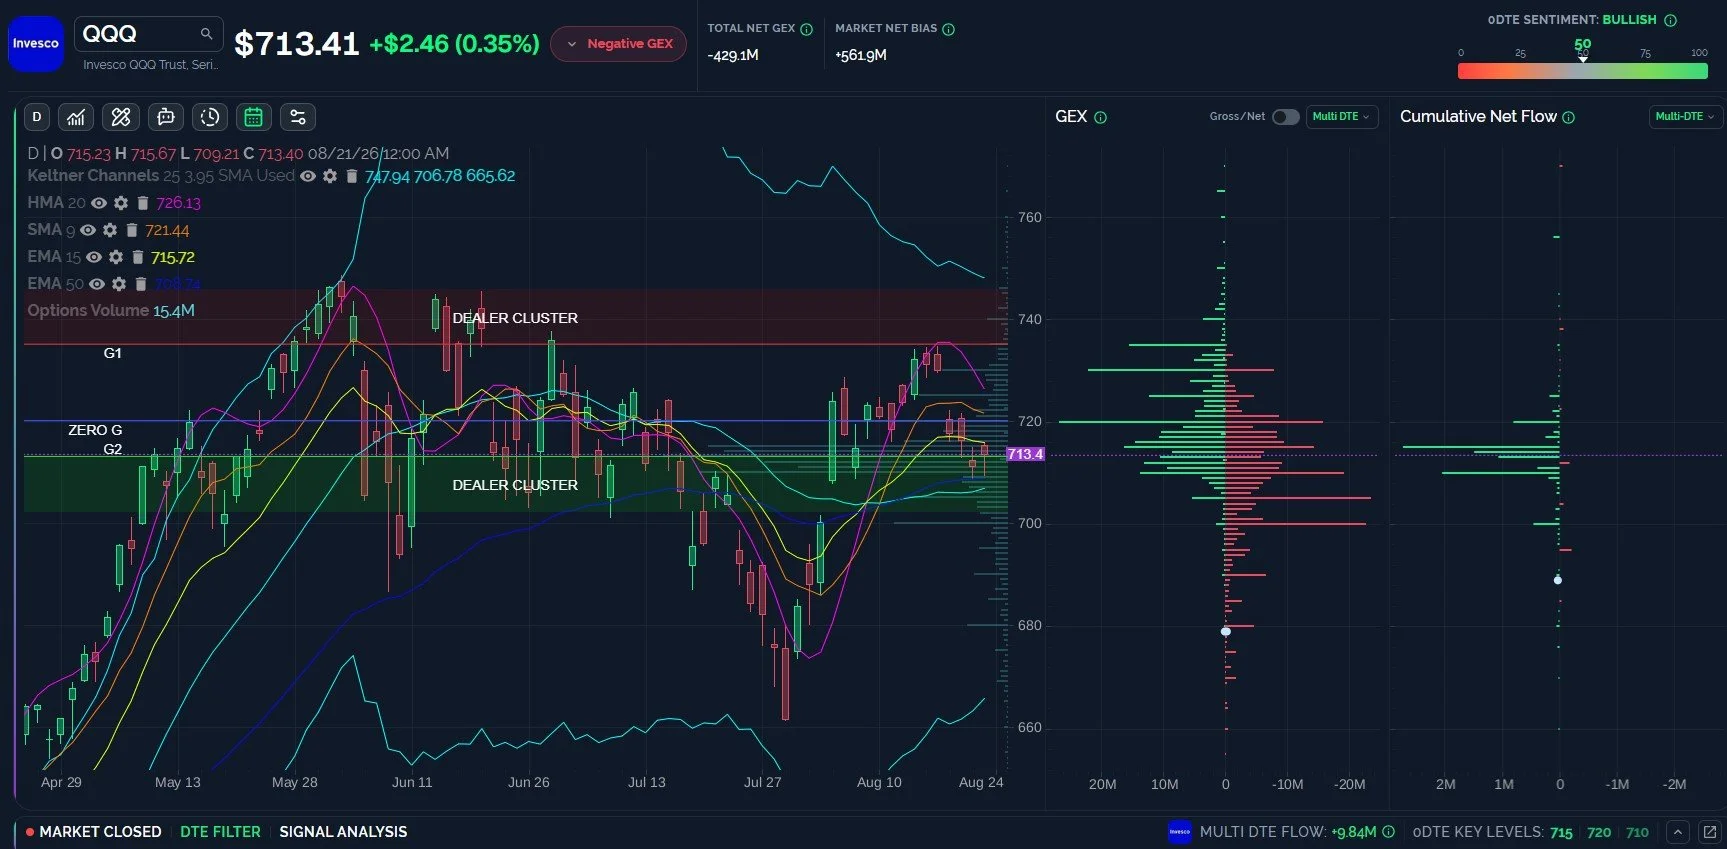
The daily chart with this week’s GEX selected brings in the focus a little more narrow toward 700-735, with 720 looking like a major overhead resistance area. The HMA at 726 is rapidly declining, so the HMA may be at low as 720 in short order, another level we’ll be watching.
Key Levels: Bullish above 720 targeting 730, then 735. Bearish below 710 targeting 700, then 690.
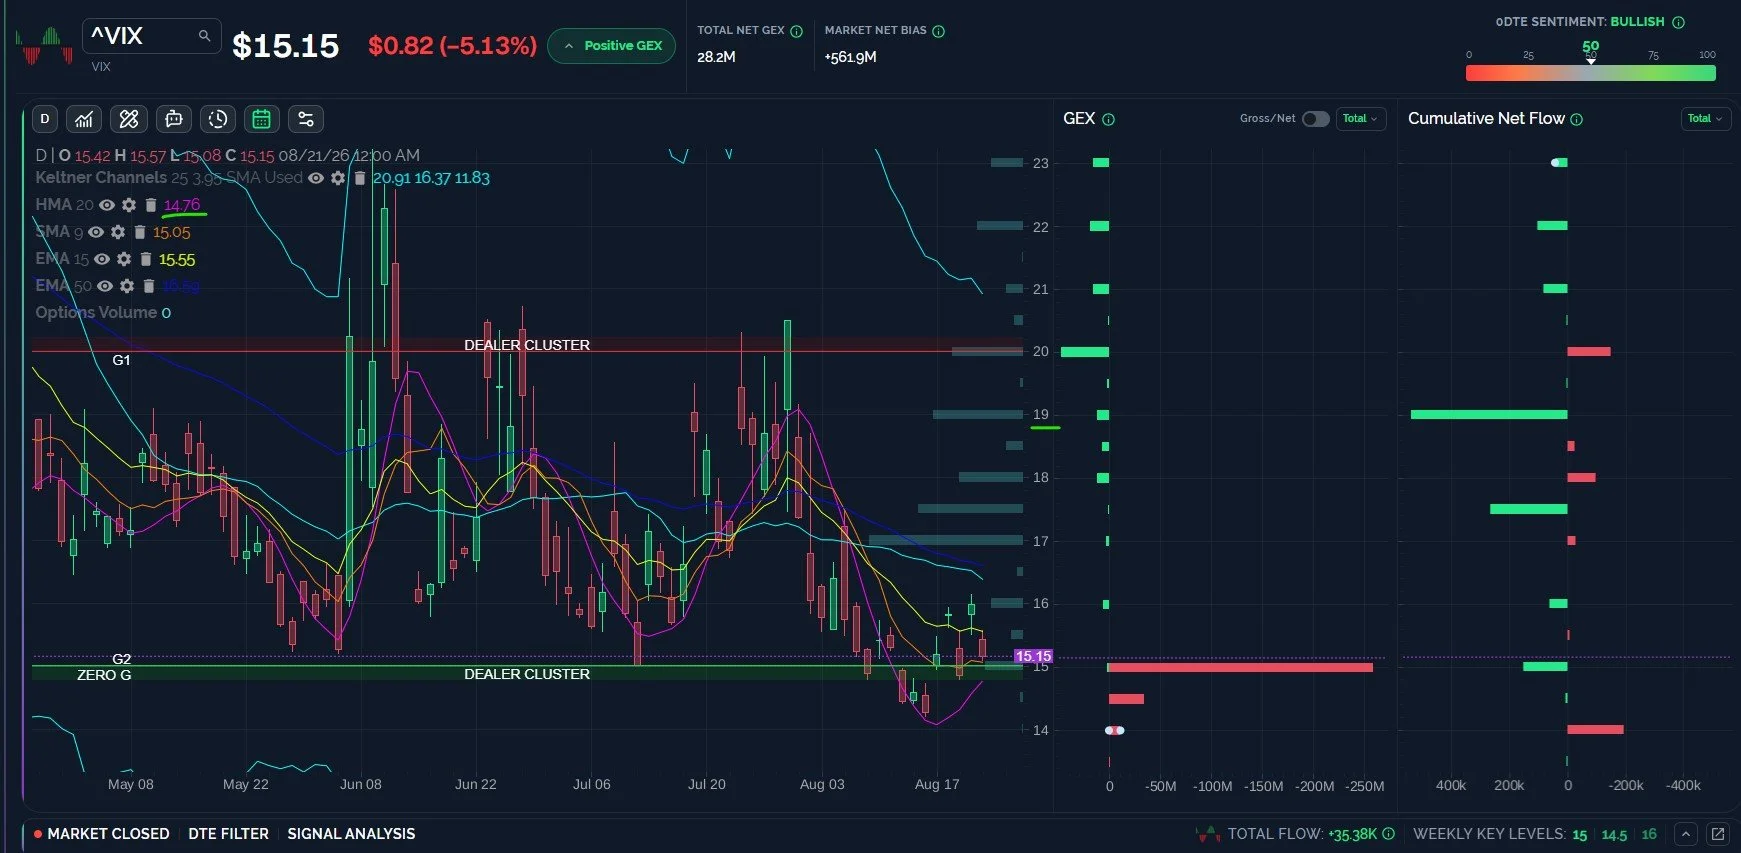
The VIX Above 14.76 Maintains a Setup For 19-20
The VIX continues printing higher lows, though last week also saw a lower high, so bulls and bears alike face risk at this critical juncture where the VIX is just above the ascending daily HMA. The VIX needs to reverse higher from 14.76 in order to target 17-19, otherwise the VIX may remain tired and slouched toward the 14 strike. We did see positive total option activity at the 19 strike Friday, and 20 aligns with the upper dealer cluster zone, so maybe we’ll see a decision soon.
Join The Discussion
We hope you will join us in Discord this week, where we will share some observations for free. Non-subscribers can join through Community on our homepage. First-time guests get a free 7-day trial of the premium Discord channels, where we talk through what is happening in real time.
Check out tonight’s YouTube video if you have a few minutes, we provide additional commentary on SPX, the VIX, and some individual stocks as well, including NVDA. You can watch the new video by clicking Community at the top of our homepage to find our YouTube channel link.
Join our livestream by clicking the link on our homepage every day around 10:30am ET, and you can replay the most recent one any time before the next one begins. We also post this link in Discord when we’re ready to start.
We now have a live demo on our homepage for those who want to explore the main sections of our website, so we invite non-members to check it out!
Thanks for being part of our community and know that we invite and appreciate your feedback!
The information provided by Geeks of Finance LLC is for educational purposes only and is not intended to be, nor should be construed as, an offer, recommendation or solicitation to buy or sell any security or instrument or to participate in any transaction or activity. Please view our Investment Adviser Disclaimer and Risk Disclosure.
