
SPX, QQQ, IWM, VIX all Diverging into October’s OpEx Cycle
Friday saw a very mixed conclusion to September’s OpEx, with SPX and IWM underperforming QQQ as the VIX retests sub-15 levels. IWM negative GEX reached a stunning -4.8B, a number I’m not sure I’ve seen before (automatic discount applied to my memory, however), while QQQ climbed higher into positive GEX territory and SPX dropped back into negative territory. Nothing screams “bullish conviction” like major indices in their own completely different worlds (sarcasm intended). Tonight we look ahead at initial positioning into the October OpEx cycle and hint at some possibilities to watch for in coming weeks.
Interested in getting access to our tools and most active Discord channels? Save $300 off of the annual Portfolio Manager plan with code SEPTEMBER26 at checkout!
SPX Faces Resistance at 7700, Pullbacks may be Bought with an 8000 Target
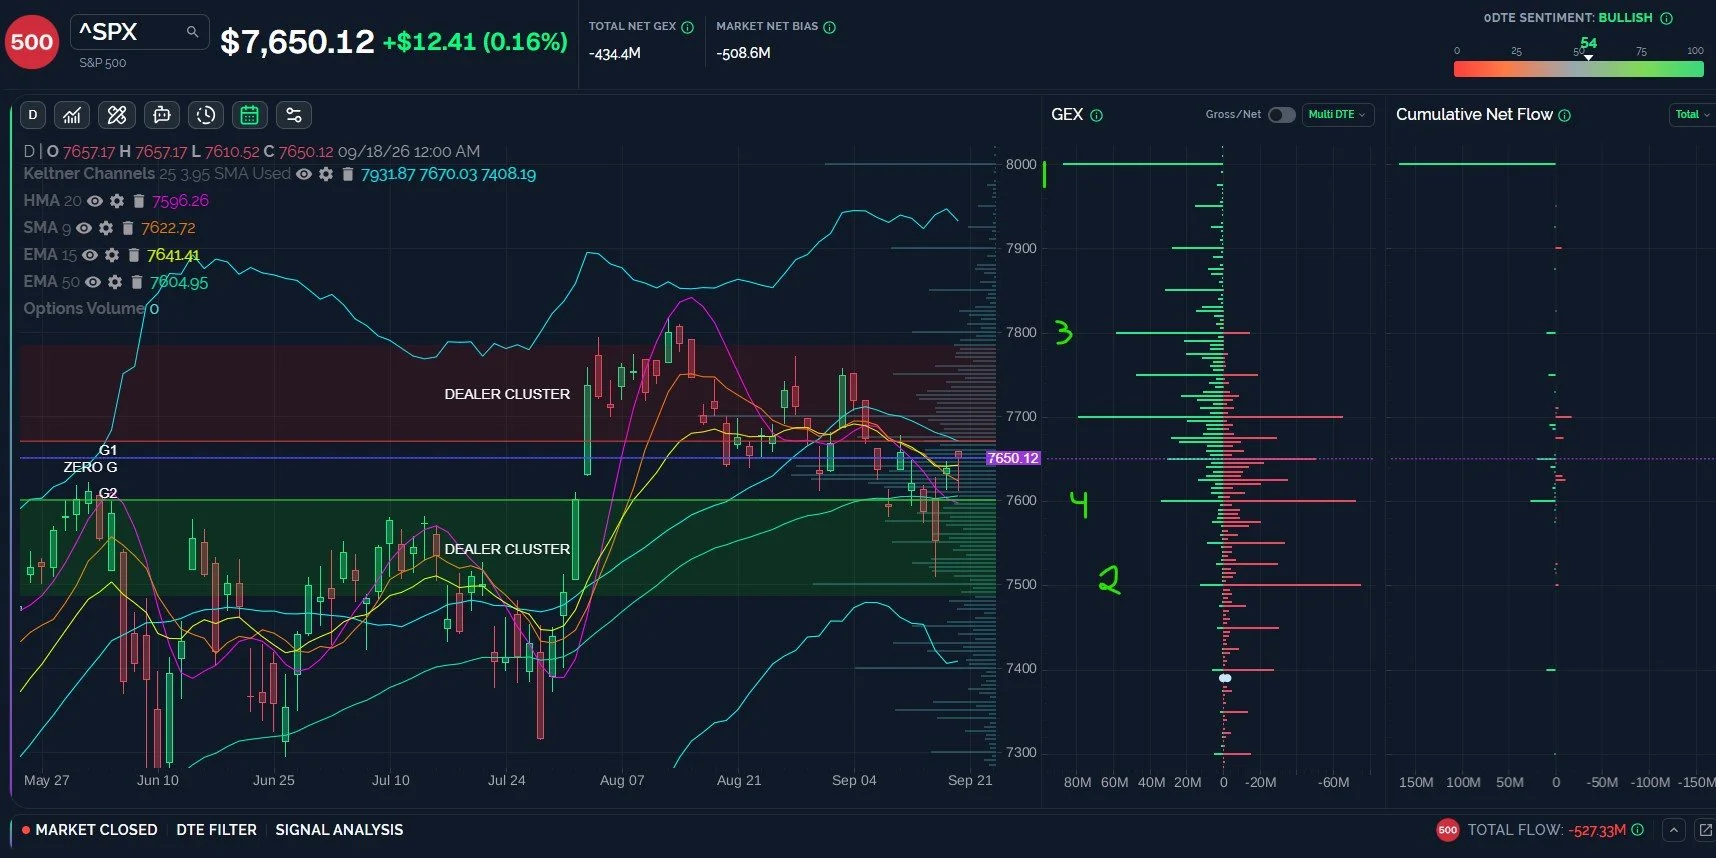
The gross GEX picture into the October OpEx shown below highlights important resistance at the 7700 strike, which we view as a key pivot for upside or downside scenarios. I’ve added rankings next to the largest net GEX clusters, which show 8000 to be the largest net GEX cluster, followed by 7500, 7800, then 7600. GEX diminishes above 7800, until we see 8000. My conclusion is that we have risk to 7500 until 7700 is reclaimed with a daily close above that level, while a close above 7700 likely brings 8000 into focus as a major topping area.
Key Levels: Bullish above 7700 targeting 7800, then 8000. Bearish below 7700 targeting 7600, 7500.
QQQ Appears to have Limited Upside, 690 Before 750?
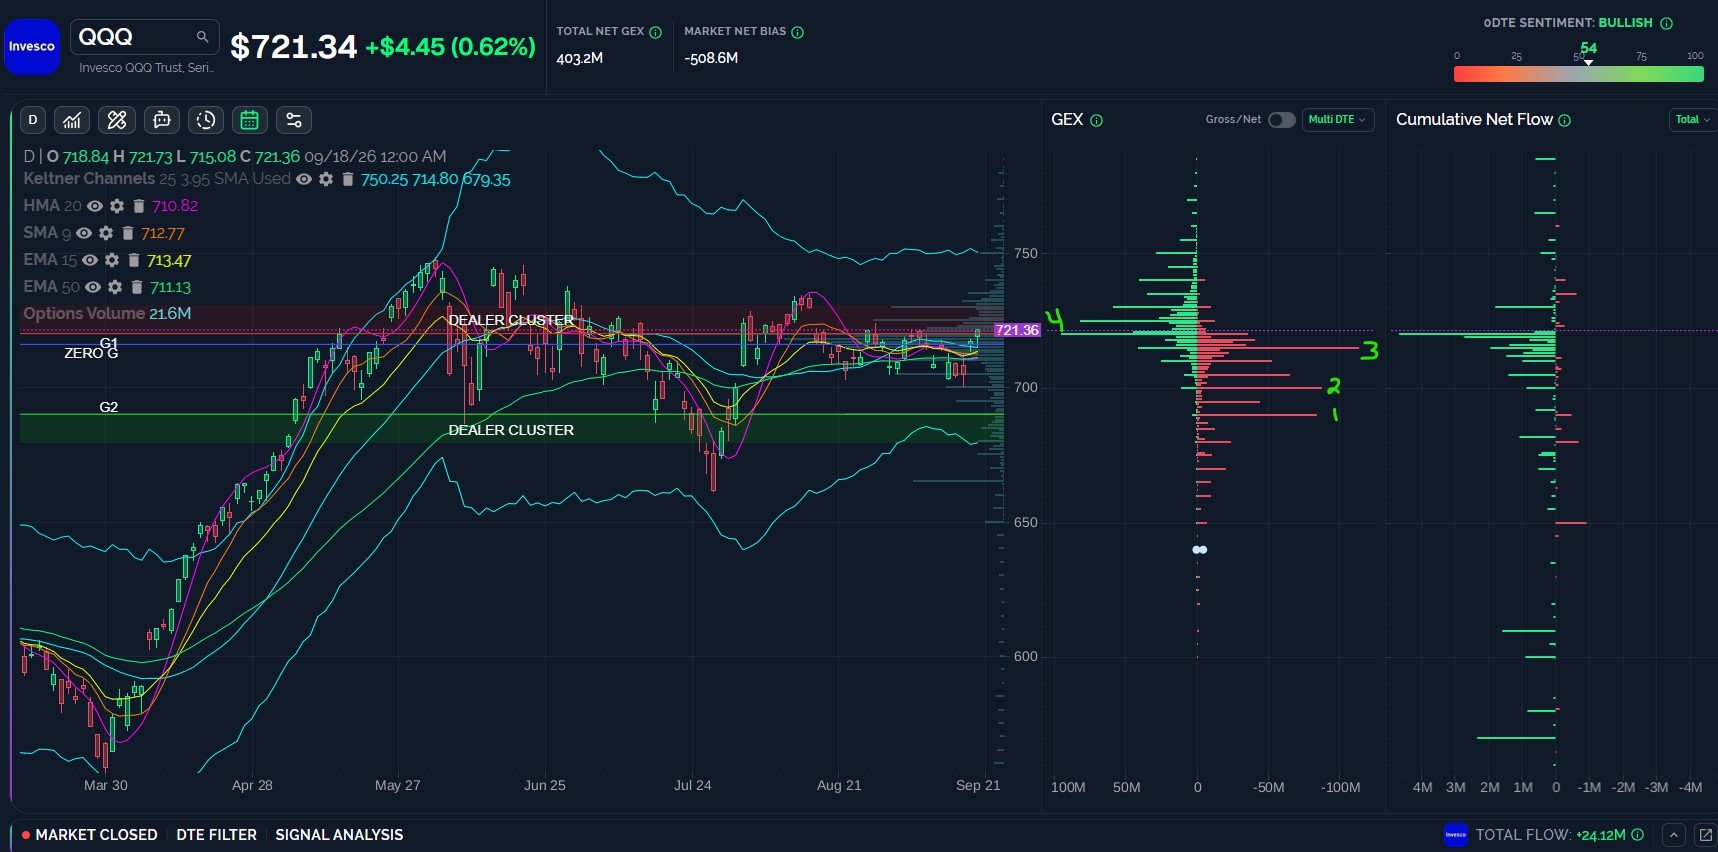
QQQ looks bullish on the surface, closing above 720 on Friday, a level we’ve noted for days as an important pivot toward upside targets. Futures seem to be validating our view with a move toward 725 Sunday evening. GEX diminishes sharply after 725, though ultimately, we may see 750 reached, which aligns with the upper daily Keltner channel. I ranked net GEX in similar fashion to our last post about SPX, revealing 690 as the largest net GEX cluster, followed by 700 (a previous HUGE pivot that has since shifted), then 715, then 725. The recurring theme between SPX and QQQ is the presence of a relatively large net GEX cluster at lower strikes, implying risk to the downside, even if the resolution is higher. That’s why we discuss tactical levels that help us determine which side is likely to be the first tag. We need to consider the VIX in this equation, so let’s finish our review of major indices with IWM and then look at the VIX as of Friday’s close.
Key Levels: Bullish above 720 targeting 725, then possibly 730. Bearish below 715 targeting 700, then 690.
IWM Net GEX Reaches an Eye-Popping -4.8B, SHort Squeeze Imminent?
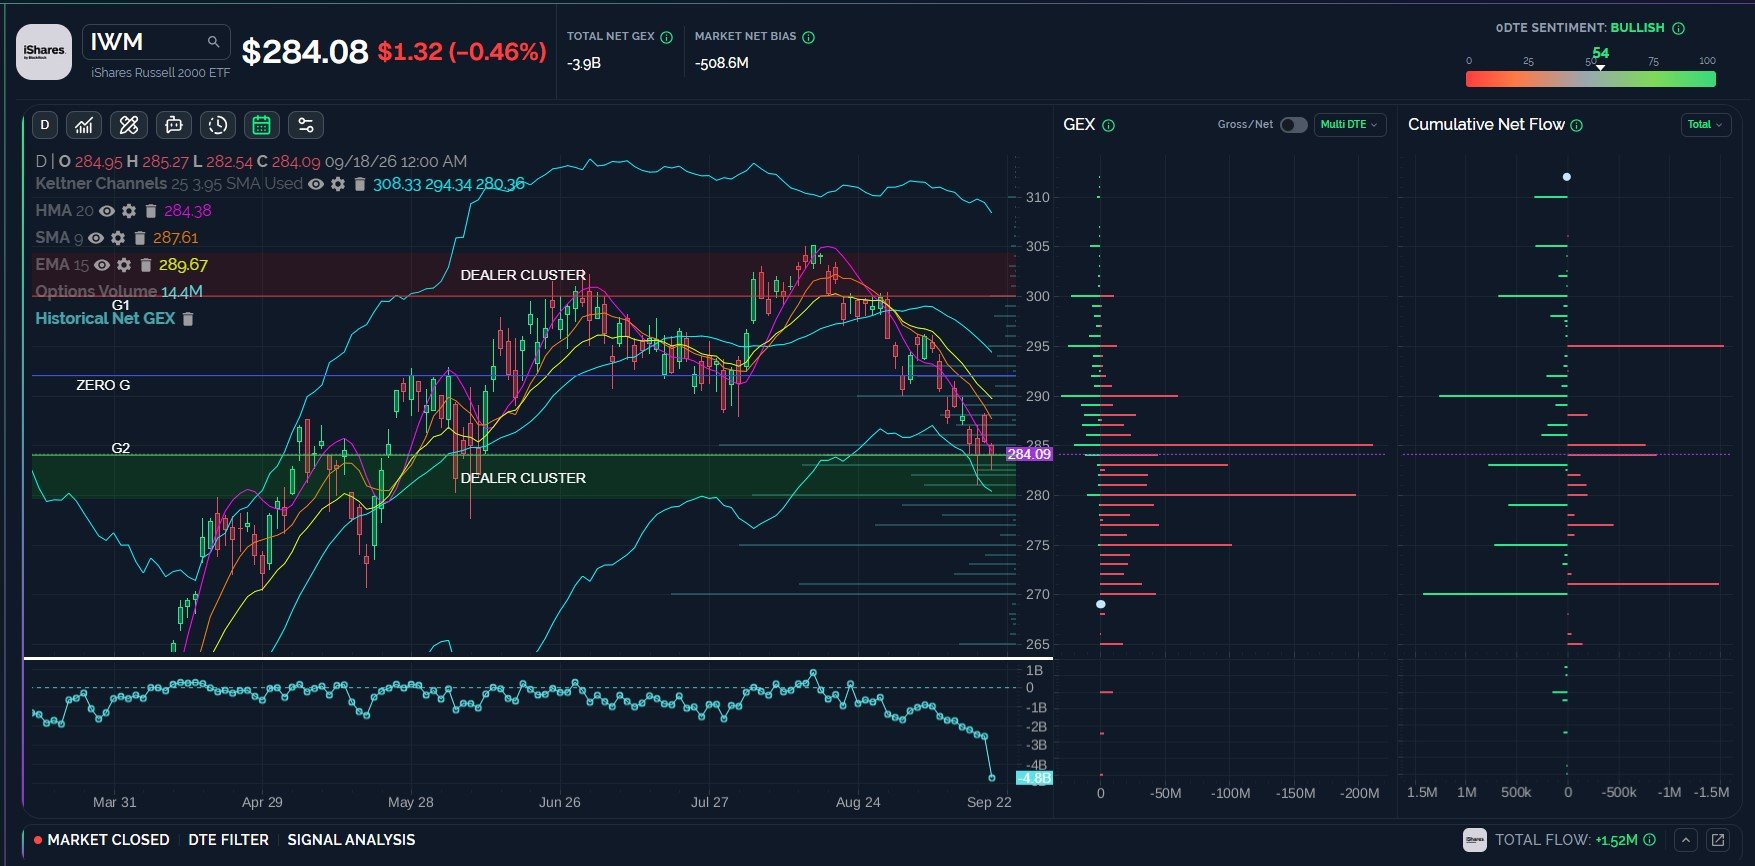
IWM’s chart appears neutral to bearish in my view, with 9 out of the last 11 daily candles closing red and the Keltner channels appearing slightly bearish. The GEX picture is no different, with extreme negative GEX and an apparent ceiling at 290. Net GEX at Friday’s closed was an abysmal -4.8B, the largest negative reading I can remember, well past the -2B area we consider “extreme” when compared to readings we’ve seen over the last year. IWM maintains risk down to 280, and below that 275, but the nature of the extreme negative net GEX reading historically increases the risk of a snapback rally, even if temporary. Perhaps the implications of the bearish chart combined with the extreme negative readings support the view of a painful short squeeze that is then sold? I would NOT want to be short IWM personally, though the implications for other asylum patients SPX and QQQ remains unknown. I lean toward IWM contrarian bullish signals carrying some weight when looking across the spectrum.
Key Levels: Bullish above 290 targeting 295, 300. Bearish below 285 targeting 280, 275.
VIX Maintains Positive GEX, Likely Bottoming Again
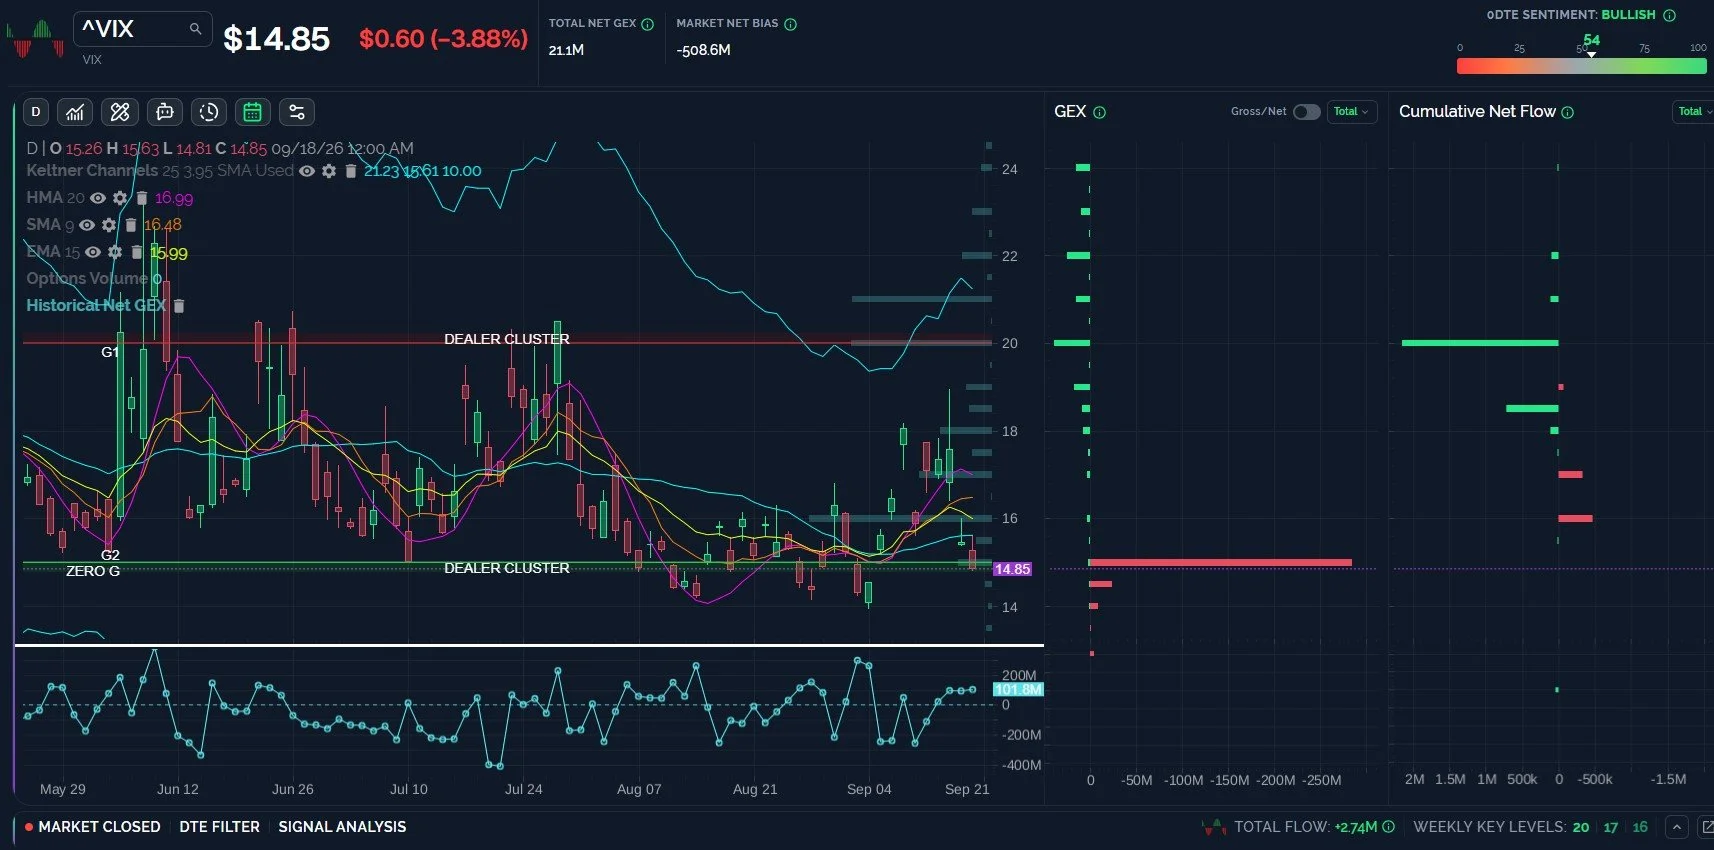
Nothing like two contrarian signals pointing in contrarian directions, but that’s what we see when we look at the VIX, which continues to print positive net GEX readings even as the VIX plunges. One possible explanation between the VIX and IWM’s contrarian bullish signal involves a difference in timeframes. We might see a spike in the VIX, but perhaps it’s short-lived, with IWM mooning after such a spike, as an example. These divergences are likely short-term in nature, in other words.
Key Levels: Bullish above 15 targeting 19-20+. Limited downside below 15 targeting 14.
Join The Discussion
Non-subscribers can join our great Discord community with all of its experienced traders by clicking Community on our homepage. First-time guests get a free 7-day trial of the premium Discord channels, where we talk through what is happening in real time.
Our YouTube videos can be viewed by clicking Community at the top of our homepage to find the channel link. We posted a new YouTube video tonight discussing the major US indices as well as several individual stocks, so check it out if you have a few minutes.
Join our livestream by clicking the link on our homepage every day around 10:30am ET, and you can replay the most recent one any time before the next one begins. We also post a link in Discord when we’re ready to start.
We now have a live demo on our homepage for those who want to explore the main sections of our website, so we invite non-members to check it out!
Thanks for being part of our community and know that we invite and appreciate your feedback!
The information provided by Geeks of Finance LLC is for educational purposes only and is not intended to be, nor should be construed as, an offer, recommendation or solicitation to buy or sell any security or instrument or to participate in any transaction or activity. Please view our Investment Adviser Disclaimer and Risk Disclosure.
