Net GEX strongly suggests SPX will reach 7900-8000 in coming weeks (what do we have- 13 weeks left in the year?!), but divergences are building with the VIX that suggests a backtest of 7000 or lower may be due before bulls declare their 42,069th victory since “Too Big to Fail” took over. Let’s look at major indices for the October OpEx cycle.
Interested in getting access to our tools and most active Discord channels? Save $300 off of the annual Portfolio Manager plan with code SEPTEMBER26 at checkout!
SPX Appears Ultimately Destined for Higher Levels- Timing is Key
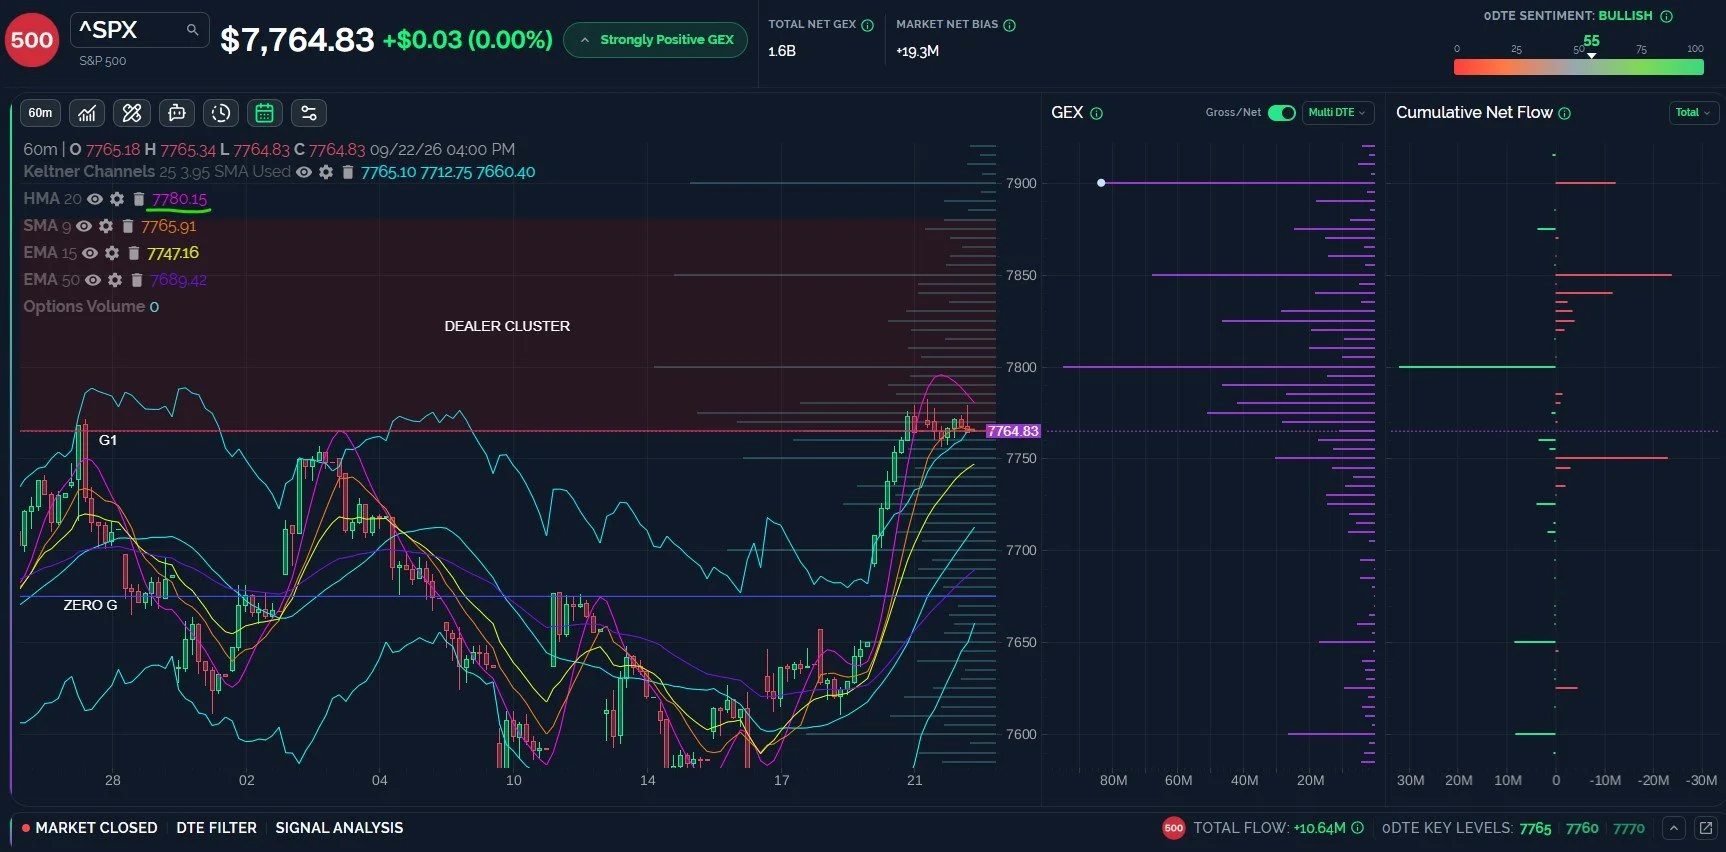
The net GEX picture for SPX (shown below with horizontal purple bars) shows a lop-sided bias toward the upside, and SPX isn’t even near a GEX extreme yet, on the total timeframe. This strongly suggests we see higher prices at some point between the end of October and the end of the year. Several factors suggest we may see another downside attempt in order to build enough “fuel” from disgruntled bears to propel the move toward SPX 8000. Ideally, SPX would fill the gap back toward 7650, then move higher. A level low enough to scare weak bulls while giving bears hope that the bullish dreams are over. SPX’s 1-hour chart looks bullish, but the HMA is now over the current price and pointing lower, perhaps my favorite directional indicator. Lower timeframes point toward consolidation for SPX, in other words.
Key Levels: Bullish above 7780 targeting 7800, where consolidation is expected. Bearish below 7747 targeting 7700, then 7650.
QQQ GEX is Mostly HIGHER; Indicators Suggest Consolidation First
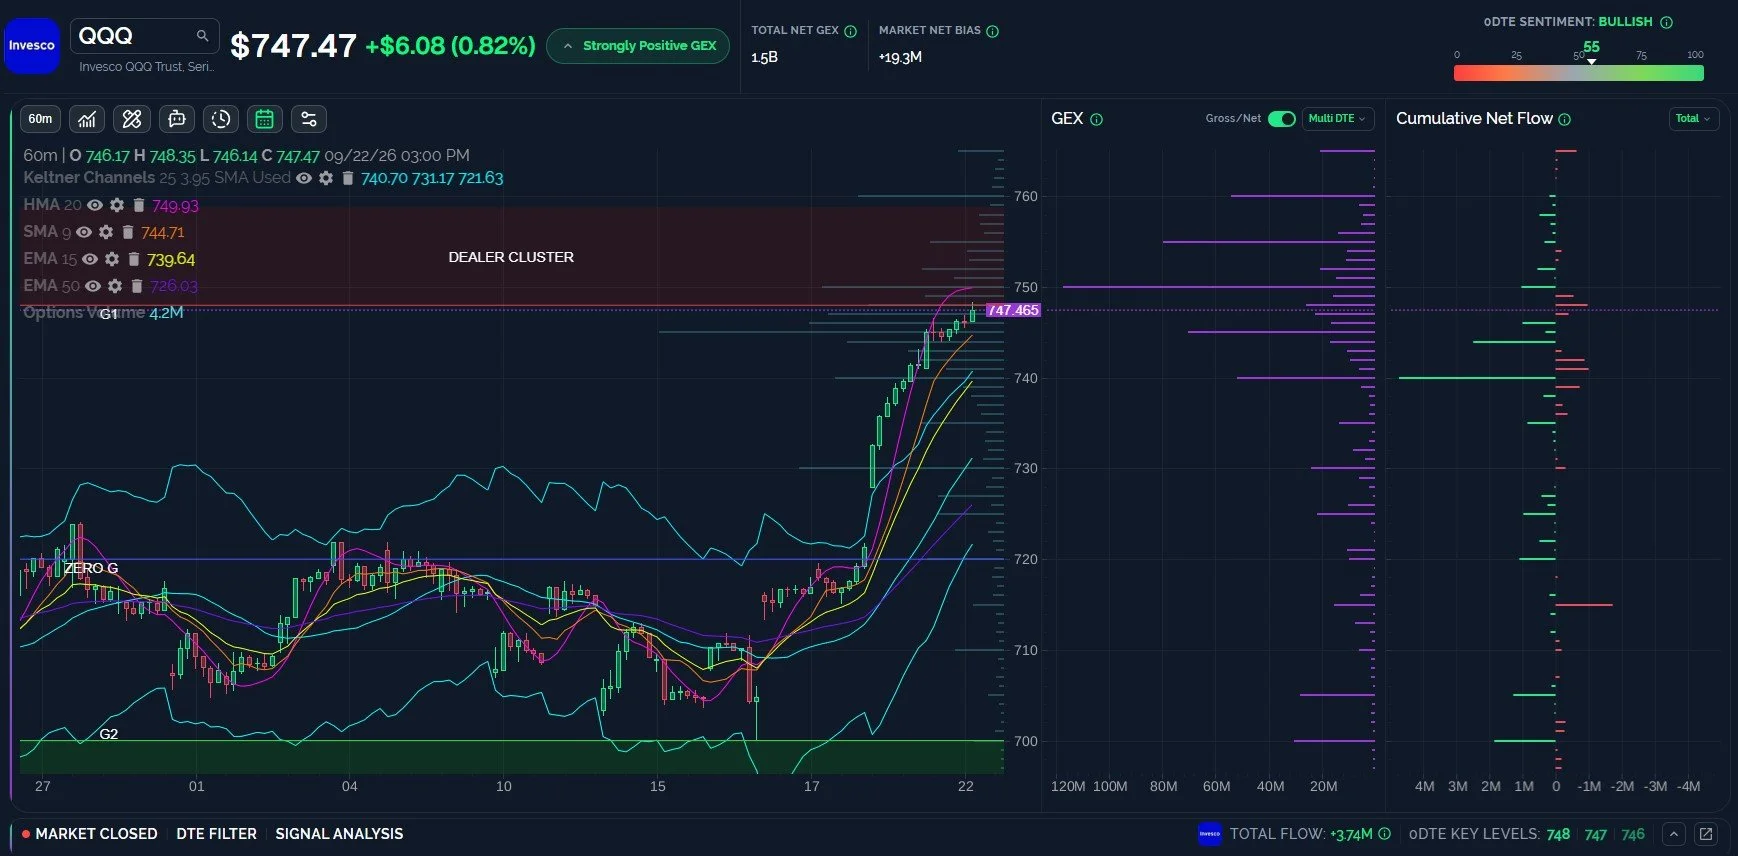
750 is the big spot we’re watching for QQQ, the largest net GEX cluster and the HMA, which has flattened recently after moving above QQQ’s price. Such conditions are among my favorites when looking for pullbacks, but sometimes consolidation can occur sideways instead of down, a risk contrarians need to be aware of. I’d love to see a gap fill to 720, but GEX diminishes beyond 740 to the downside, while positive GEX extends up to 760, so a tactical view going level by level is our preference.
Key Levels: Bullish above 750 targeting 755, 760. Bearish below 750 targeting 745, then 740.
VIX net GEX Jumps to Positive Reading Not Seen Since the Last Meaningful Low
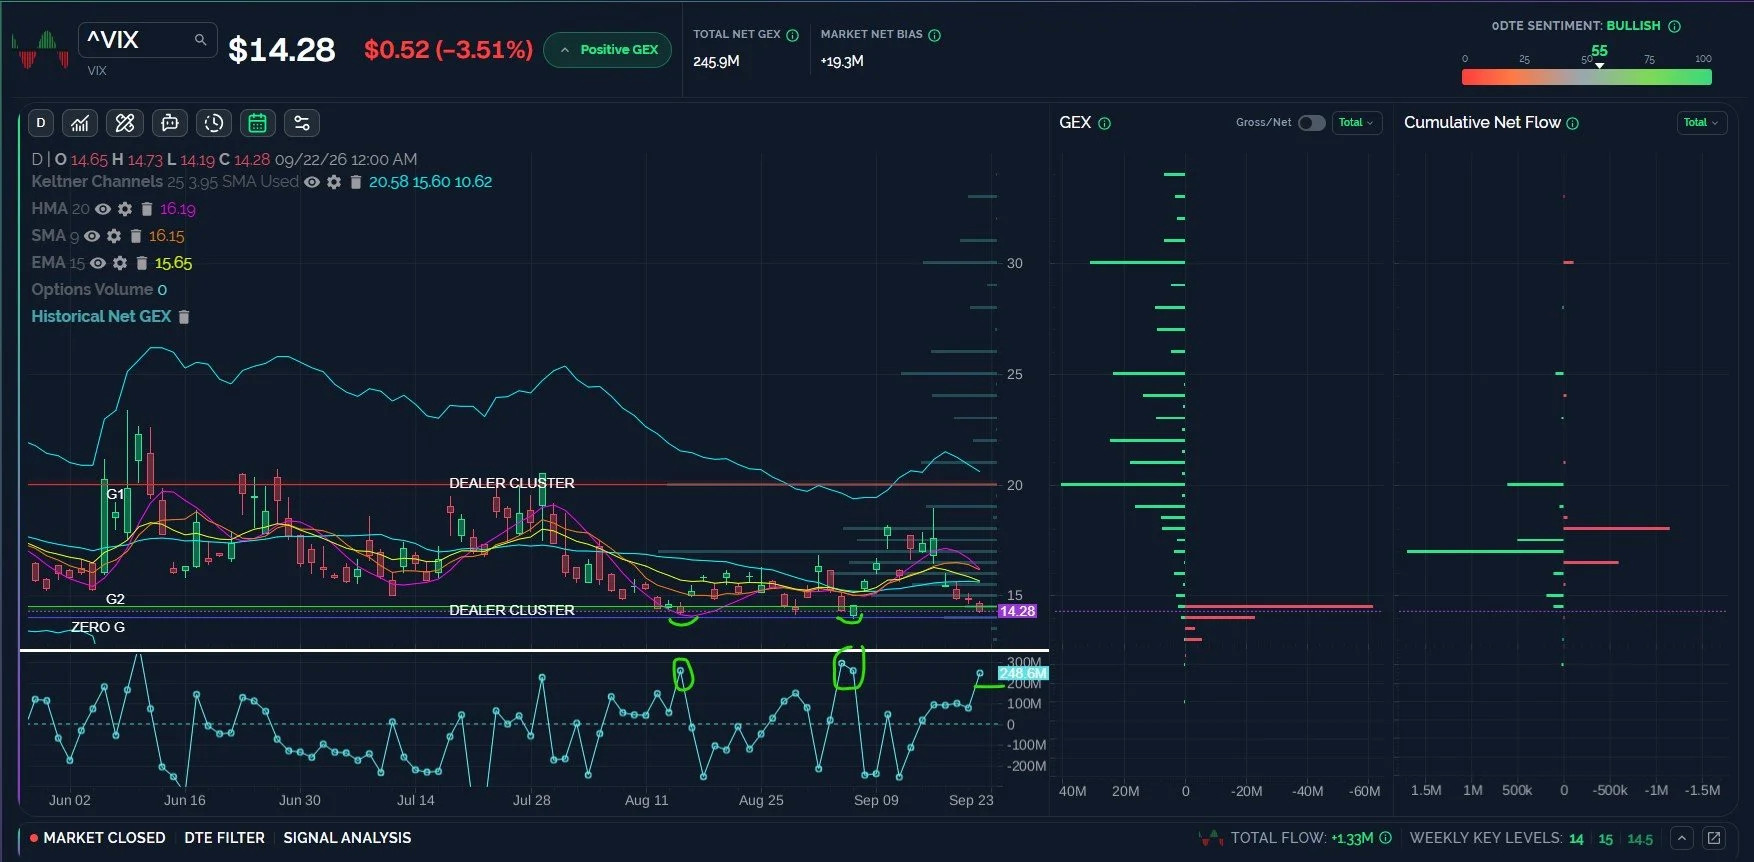
VIX action certainly looks negative, but that’s no surprise for the favorite dead horse bulls like to beat repeatedly. More concerning are the contrarian signals that have some precedent: The absolute importance of the 14-level based on prior lows this year and the increasing positive GEX, contrary to the singular downward pressure on the VIX. Particularly since the end of July, VIX net GEX highs have accompanied pivot points for volatility to expand. I’ve circled key areas in the graphic below using OI (organic intelligence). Any VIX spike may only retest the thick cluster of moving averages between 16-16.5, so the burden of a larger spike is upon market bears to move beyond VIX 17 and head toward 20+.
VIX 1-Hour Chart SUggests Volatility Rebound is Imminent
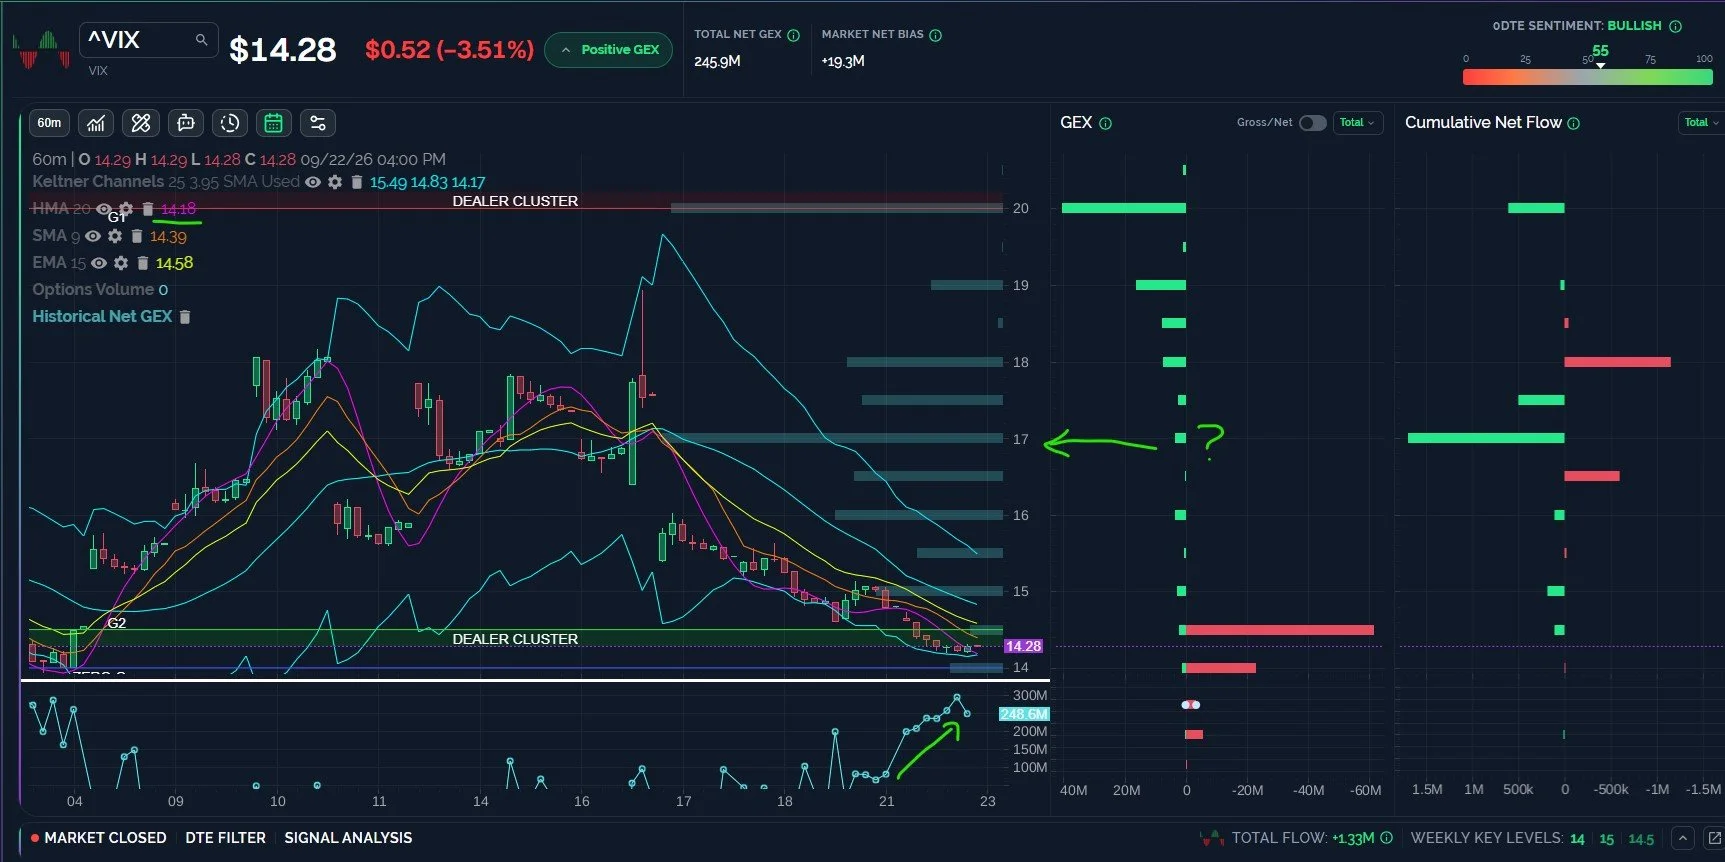
Let’s zoom in and look at the 1-hour chart, showing GEX moving up completely inverse to the drop in the VIX, once we saw the 15-strike lost. We also see the first 2 1-hour candles where the VIX crossed over the HMA at the lower Keltner channel. If you get out your magnifying glass (you know, the round piece of glass you used to burn ants as a kid), you’ll also see the lower edge of the Keltner channel turning higher. These are early speculative signs that a volatility turn may be around the corner.
Key Levels: Bullish (for volatility) above 14.5 targeting 16-17. Limited downside below 15 targeting 14.
Join The Discussion
Non-subscribers can join our great Discord community with all of its experienced traders by clicking Community on our homepage. First-time guests get a free 7-day trial of the premium Discord channels, where we talk through what is happening in real time.
Our YouTube videos can be viewed by clicking Community at the top of our homepage to find the channel link. We posted a new YouTube video tonight discussing the major US indices as well as several individual stocks, so check it out if you have a few minutes.
Join our livestream by clicking the link on our homepage every day around 10:30am ET, and you can replay the most recent one any time before the next one begins. We also post a link in Discord when we’re ready to start.
We now have a live demo on our homepage for those who want to explore the main sections of our website, so we invite non-members to check it out!
Thanks for being part of our community and know that we invite and appreciate your feedback!
The information provided by Geeks of Finance LLC is for educational purposes only and is not intended to be, nor should be construed as, an offer, recommendation or solicitation to buy or sell any security or instrument or to participate in any transaction or activity. Please view our Investment Adviser Disclaimer and Risk Disclosure.