
Contrarian Signals Stacking Up- SPX Still Looks Bullish for Q4
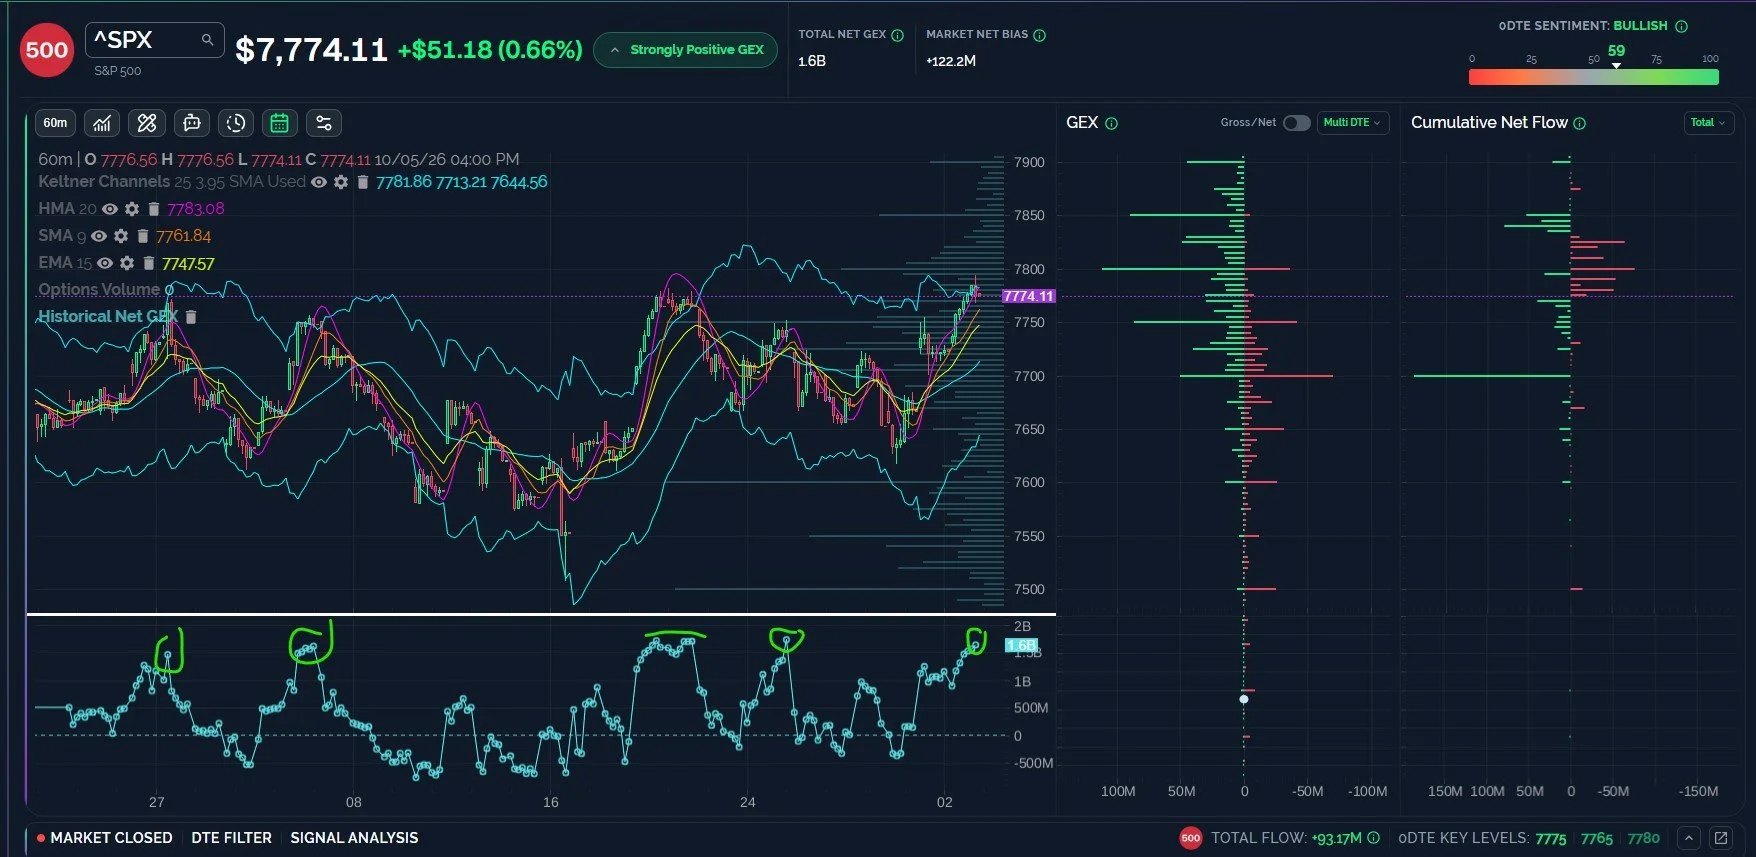
Today’s bullish action saw SPX test the upper Keltner channel on the 1-hour chart, also representing the weekly HMA at 7772. Divergences are building as indices test an important resistance area, but we also don’t want to lose sight of the likely higher targets signaled by the GEX picture into year-end.
Interested in getting access to our tools and most active Discord channels? Save $300 off of the annual Portfolio Manager plan with code PUMPKIN300 at checkout!
GEX Indicates SPX 7850 Potentially into OpEx, Total GEX Nearing Extreme
GEX undeniably looks bullish into October’s OpEx ending the 16th, but the pathway to reaching higher targets may not be a straight line. We see a likely range of 7700-7900 based on GEX, with a break below 7700 potentially seeing a larger GEX shift toward the negative, while a break above 7900 may open the door to 8000. SPX reached the upper Keltner channel on the 1-hour chart, also coinciding with the HMA on the weekly chart, and the 1-hour HMA has crossed over the upper Keltner. The HMA crossing above the upper Keltner has several examples visible on the chart below, and each of those occasions saw price consolidation afterward. Note that the circled historical closing GEX readings near the same 1.6B have marked tops.
-Primary scenario: SPX tags 7800, then drops to retest 7700.
-Alternate pathway: SPX gaps down to 7750, rallies to 7800, consolidates sideways for a few days before potentially tagging 7850-7900 into OpEx (we would want to revisit the picture upon a daily close above 7800).
Key Levels: Bullish above 7770 targeting 7800, 7850. Bearish below 7770 targeting 7750, 7700.
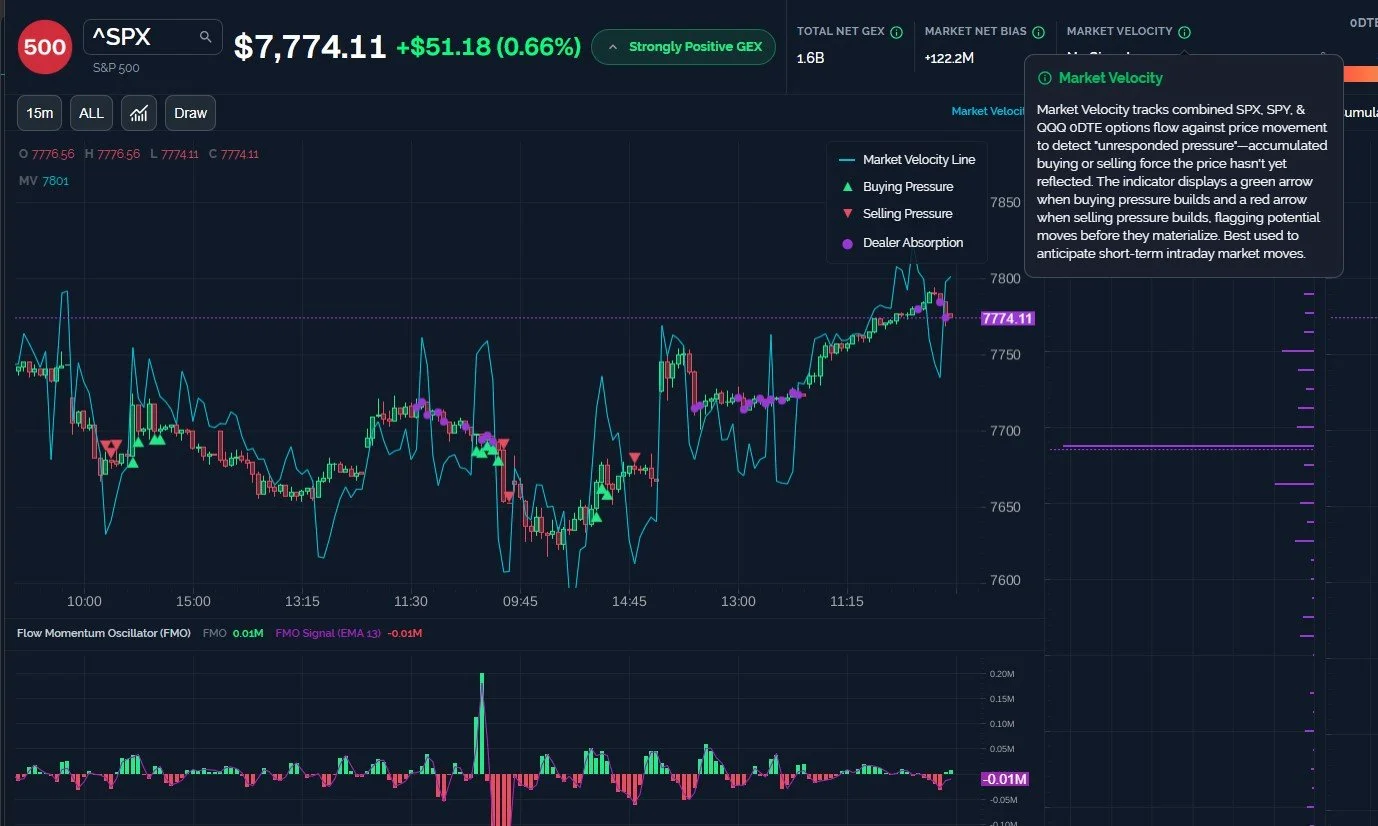
Geek’s Market Velocity Tool Dealer Absorption Signals Trigger
One additiona SPX comment: We saw additional late day Dealer Absorption signals triggered, which we also saw Friday. The last time we saw a cluster of signals (and multiple prior times before that) saw SPX drop considerably in following days. Theoretically, Dealer Absorption could occur at a low or a high, with the theme being a larger potential move thereafter than what would be expected from intraday buying or selling pressure, which may only apply to one candle.
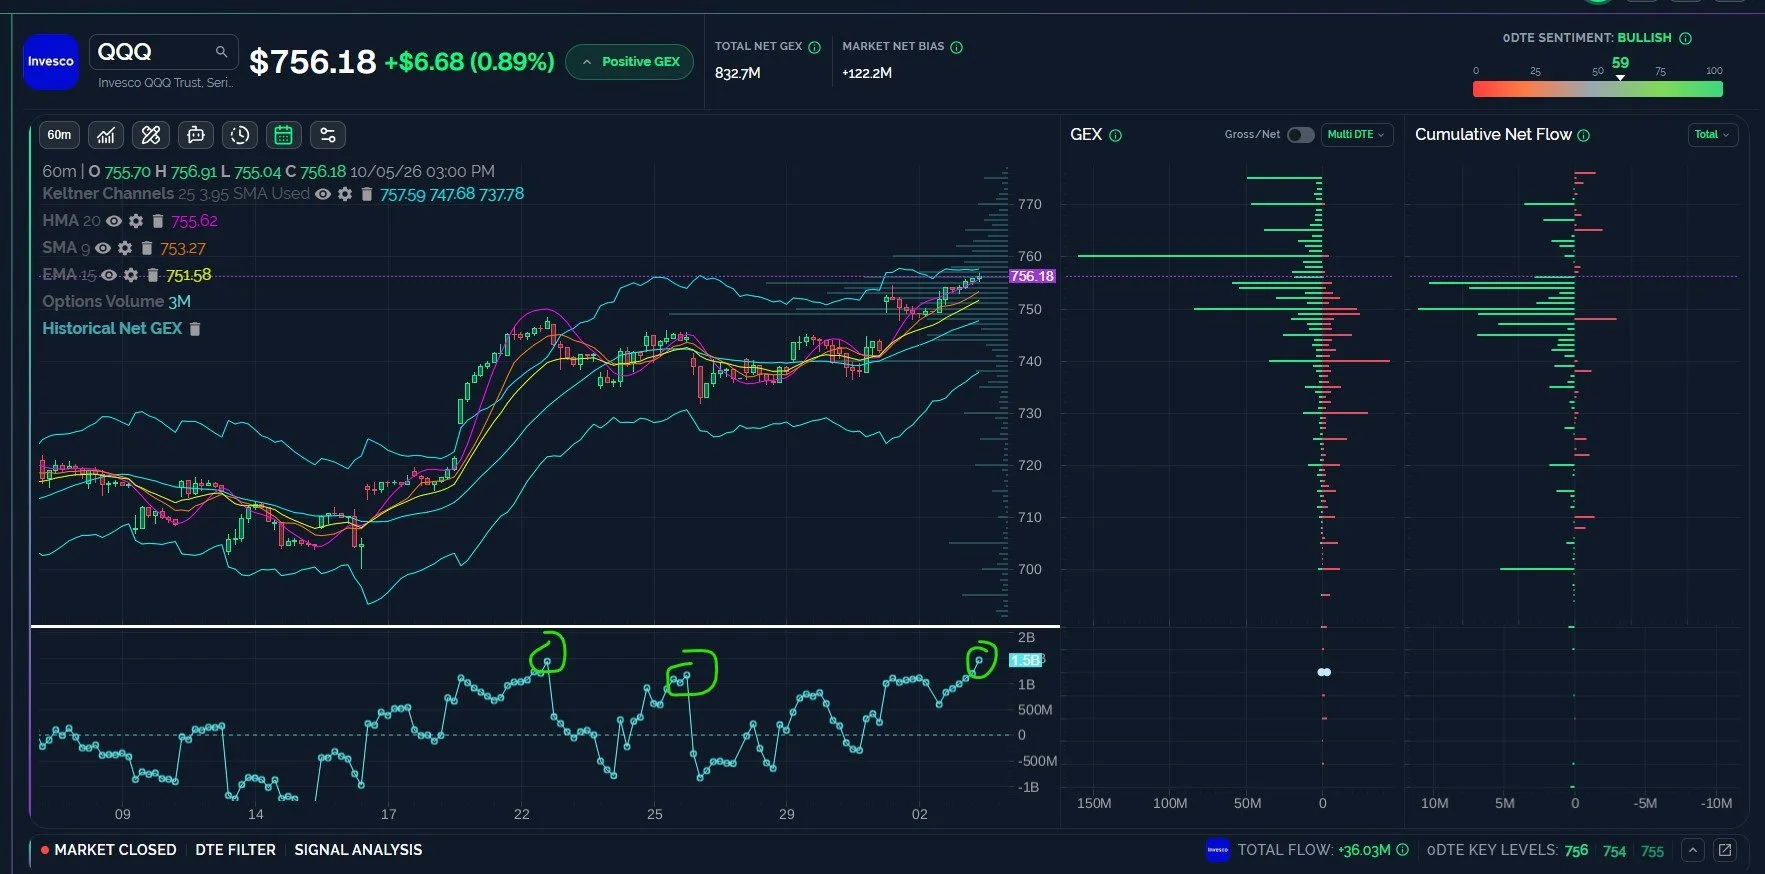
QQQ Approaches Indicator Reversal Area, Net GEX Near Prior Highs
QQQ is almost at the upper 1-hour Keltner channel, with the HMA rapidly approaching, and total net GEX has reached levels similar to recent tops, as circled below. Glancing at individual GEX clusters indicates 760 as a likely target, which is close enough to the upper Keltner to view 760 as a likely pivot. Holding above 760 stands to ignite a big squeeze toward 800, but odds currently favor further consolidation at or above 760. 740 currently appears to be a target below 750, with a close below 740 requiring a reassessment of the forward picture.
-Primary Scenario: QQQ tage 760, then sells off toward 740.
-Secondary Scenario: QQQ opens up at 750, rallies to 760 before fading back to 740.
Key Levels: Bullish above 760 targeting 775, 800. Bearish below 760 targeting 750, 740.
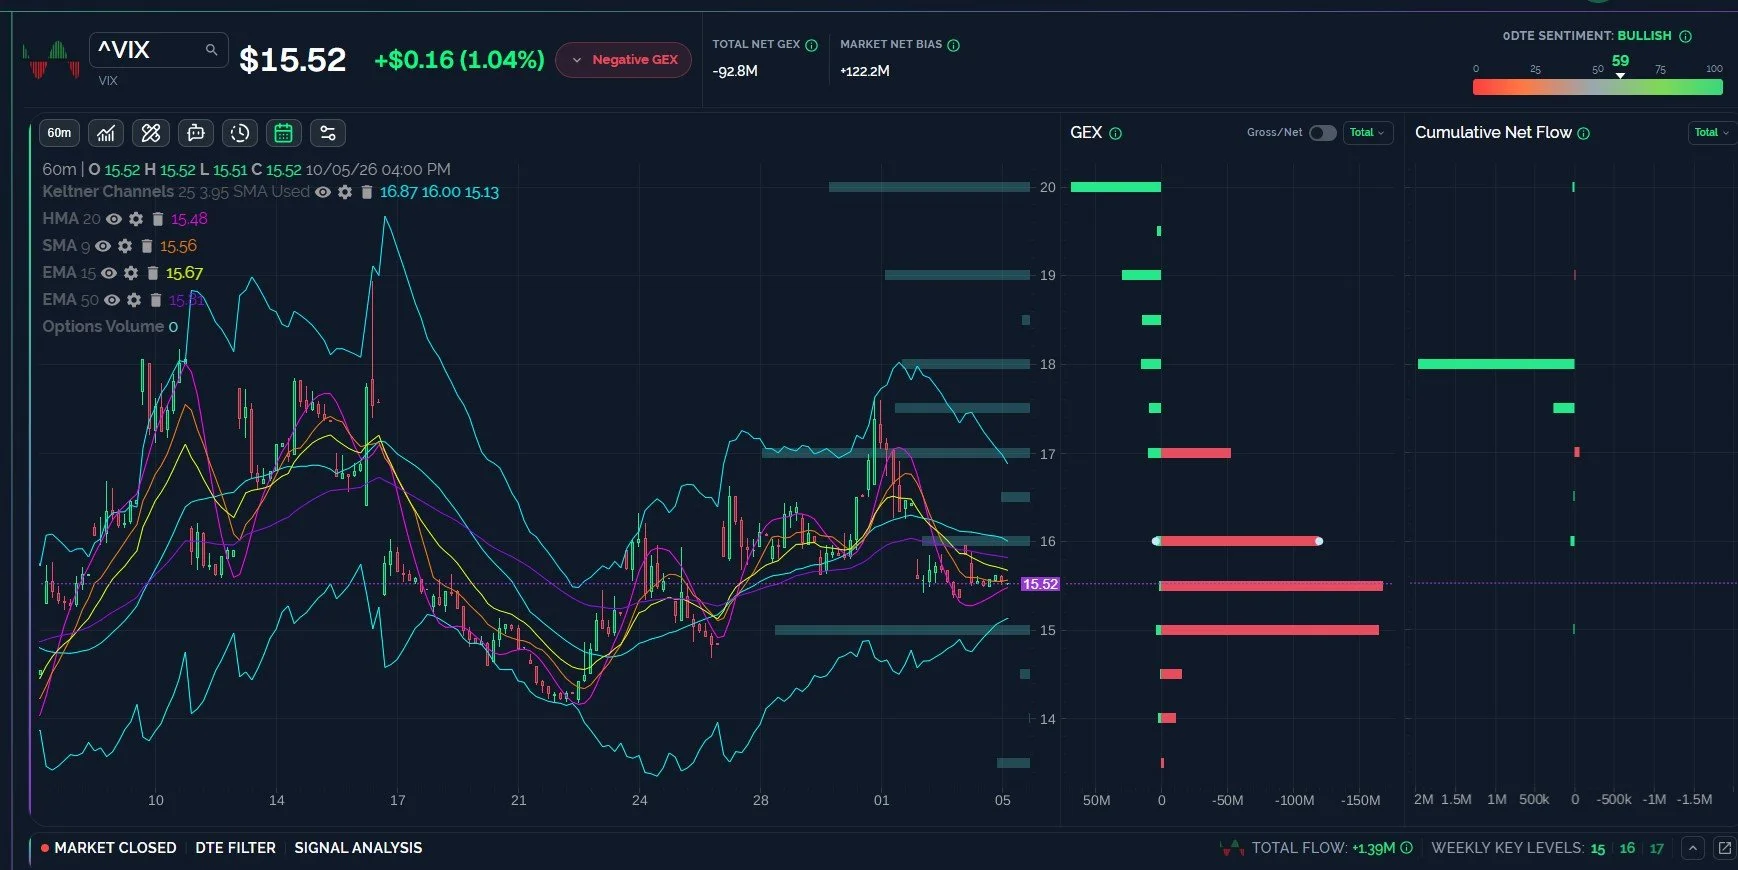
Stubborn VIX Refuses to Even Touch 15, Holds Setup for a Spike
The VIX hasn’t even dropped to 15, which even a bear wouldn’t mind seeing, and now the 1-hour chart has a setup for a spike to 17 or 20 as the daily HMA points higher and GEX dies off below 15. The GEX picture still points to the possibility of a move to 15, but such a move is likely short lasting. With SPX’s GEX picture pointing higher, any move toward VIX 20 may be a bargain for market buyers heading into a possible 8000-level tag for year-end.
-Primary Scenario: The VIX tags 17, then fades as the market rallies.
-Secondary Scenario: The VIX tags 15, then rallies to 20+, then collapses.
Key Levels: Bullish above 15.5 targeting 17, 20. Bearish below 15.5 targeting 15.
Join The Discussion
Non-subscribers can join our great Discord community with all of its experienced traders by clicking Community on our homepage. First-time guests get a free 7-day trial of the premium Discord channels, where we talk through what is happening in real time.
Our YouTube videos can be viewed by clicking Community at the top of our homepage to find the channel link. We posted a new YouTube video tonight discussing major indices as well as some individual stocks, so check it out!
Join our livestream by clicking the link on our homepage every day around 10:30am ET, and you can replay the most recent one any time before the next one begins. We also post a link in Discord when we’re ready to start.
We now have a live demo on our homepage for those who want to explore the main sections of our website, so we invite non-members to check it out!
Thanks for being part of our community and know that we invite and appreciate your feedback!
The information provided by Geeks of Finance LLC is for educational purposes only and is not intended to be, nor should be construed as, an offer, recommendation or solicitation to buy or sell any security or instrument or to participate in any transaction or activity. Please view our Investment Adviser Disclaimer and Risk Disclosure.
