
The VIX Finally Tests 15
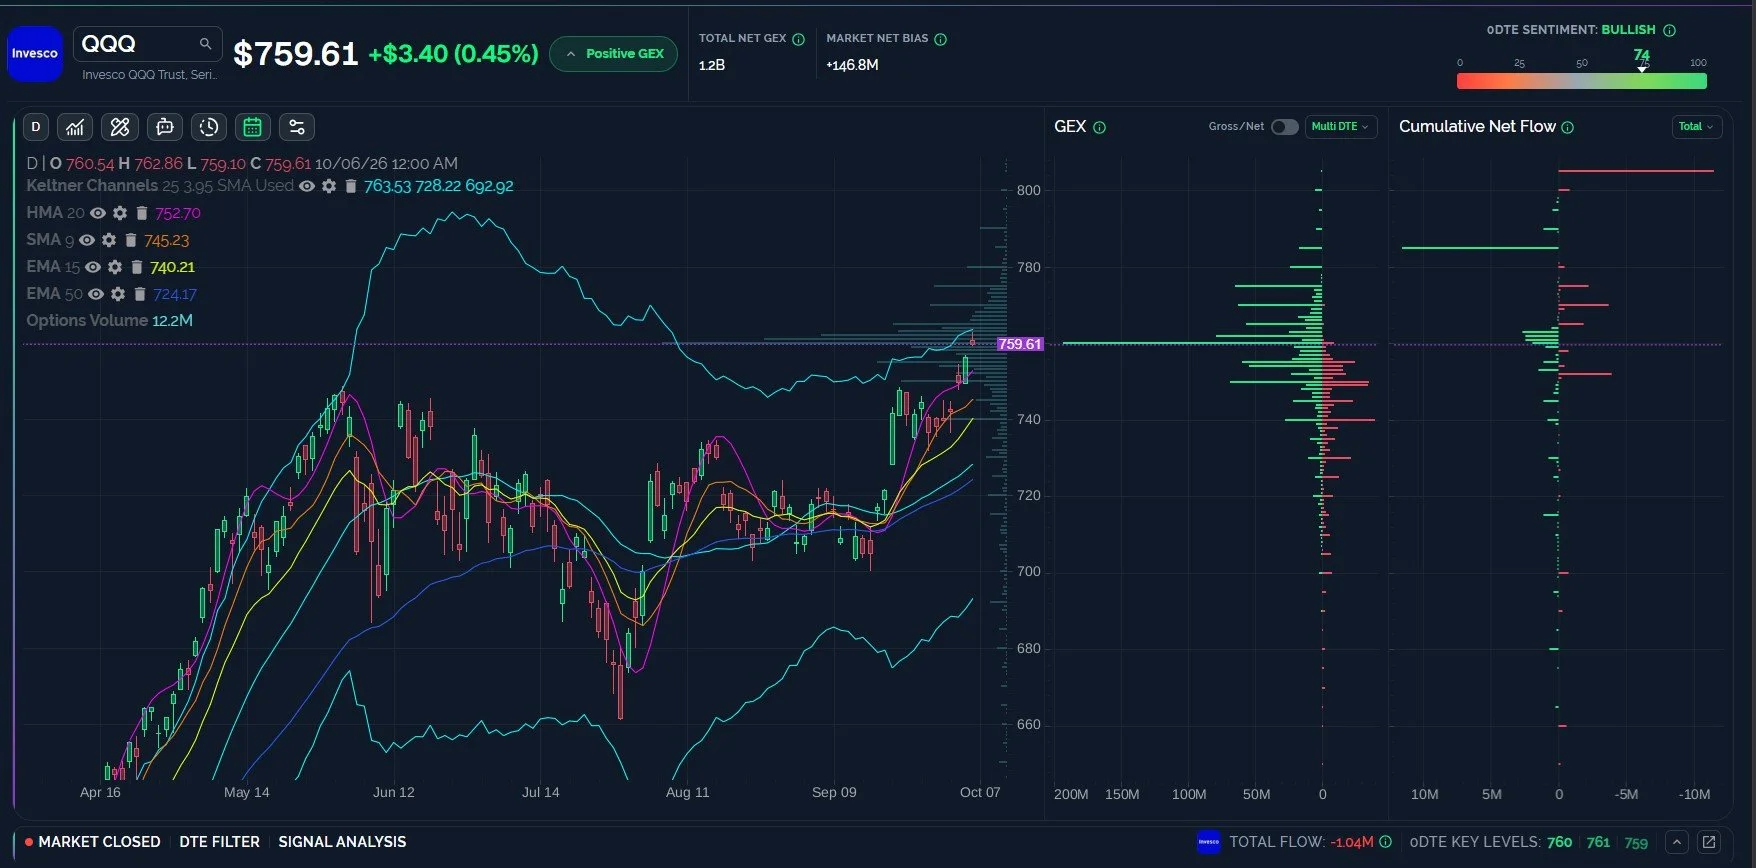
Our primary scenario envisioned for SPX was correct directionally, with a gap up to 7800 (actually 7805), but we weren’t bullish enough. The intraday high of 7844 almost tagged the next stop at 7850, while QQQ reached 762.86, just above the big GEX magnet at 760. The close just below 760 should be no surprise to those who’ve taken our GEX University course as price consolidates around the largest GEX level. With the VIX testing 15, downside may be limited, though we could see a drop to 14.4 temporarily, in theory.
Interested in getting access to our tools and most active Discord channels? Save $300 off of the annual Portfolio Manager plan with code PUMPKIN300 at checkout!
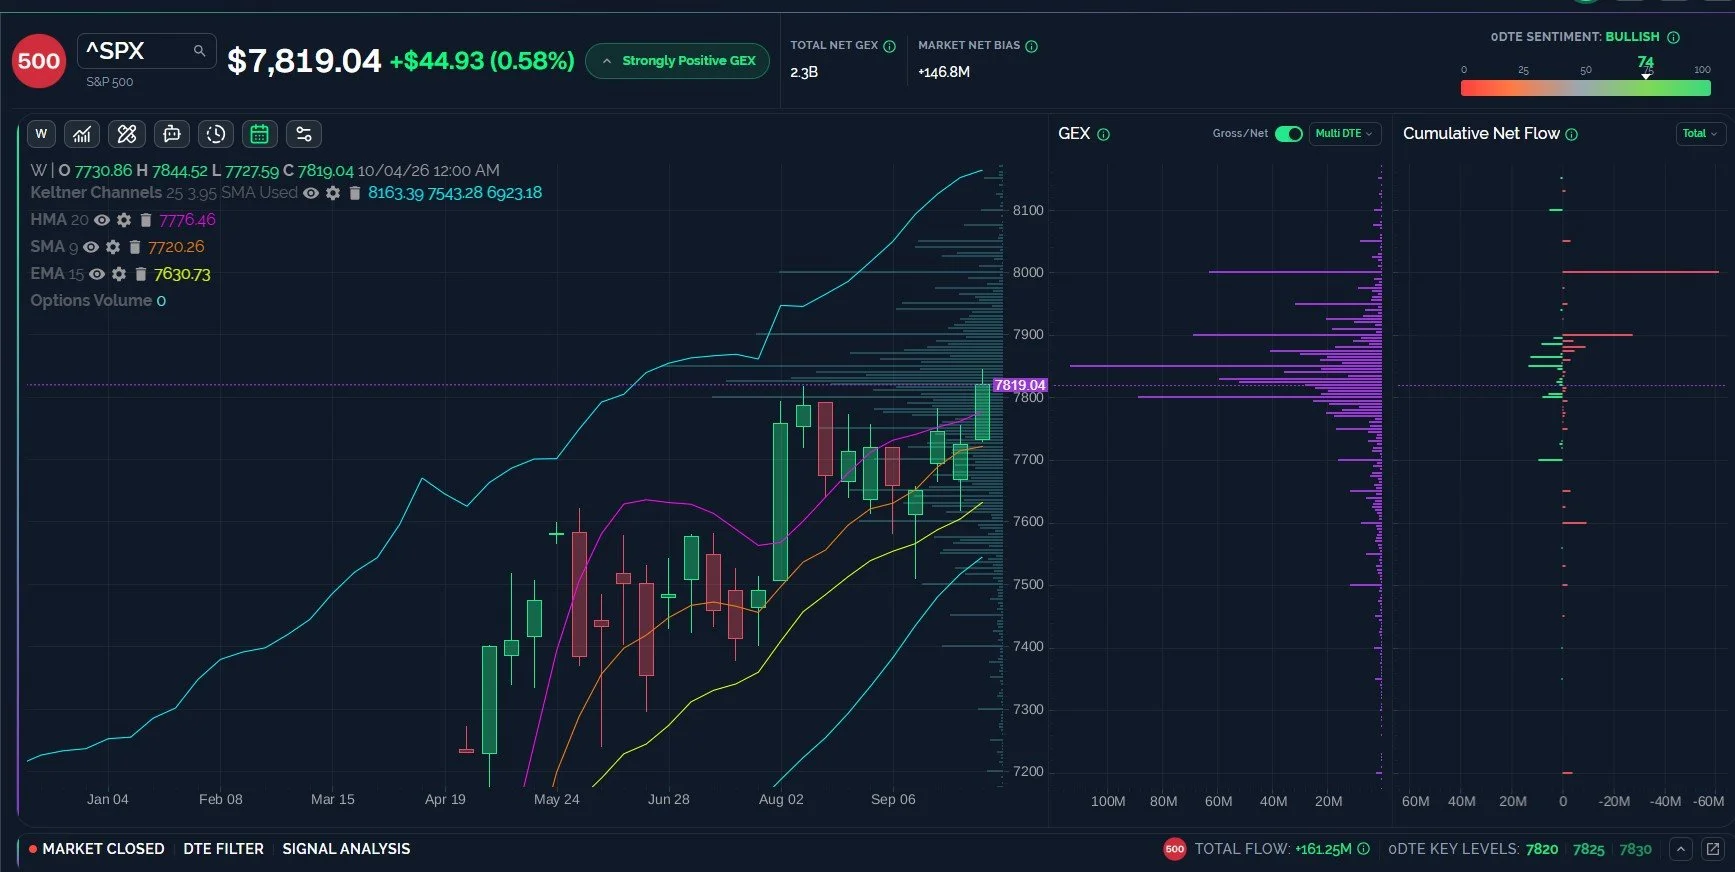
SPX Closes Above 7800, GEX Indicates Higher, Technicals Stretched Short Term
SPX is currently above the 7776.46 weekly HMA, a line I’ll be watching this week. A wick back below the line by Friday’s close may be of concern, depending on how far below the line SPX goes. Currently, looking at GEX into OpEx on the 16th (adjusted for today’s expired GEX), we see signs of potential higher highs ranging from 7900-8000. Keep in mind that SPX printed a 2.5B intraday total GEX reading, which is quite extreme, and most (but not all) prior instances were short-term tops or consolidation areas. Not bearish per se, but possibly a case of “too far, too fast.” While QQQ has reached its upper weekly Keltner channel, for SPX to do the same would mean a trip to 7951, incredibly. Will QQQ lead the way this time, forcing SPX to wait for its tag of the upper channel until later, or will QQQ pull another statistically unlikely move and spend some time above the upper band?
-Primary scenario: SPX retests 7750, possibly after reaching 7850, then continues higher toward 7900.
-Alternate pathway: SPX defies gravity and heads for 7900 in a straight line before a slightly less pleasant pullback toward the same 7700-7750 area.
Key Levels: Bullish above 7850 targeting 7900, 7950. Bearish below 7800 targeting 7776, 7750.
QQQ Rejects Just Below the Upper Keltner Channel, Action Around 760 is key
QQQ stopped at what I would call an “ideal” spot, the upper Keltner channel. At least it’s ideal for me, since I’m using Keltners. I digress. The GEX picture still looks bullish, and net positive GEX looks solid up to 775. I’ll be watching the daily HMA at 752.7 if the current red shade on my screen stays red into tomorrow, with action between the big GEX level at 750 and the HMA key to the next move. If QQQ loses 750, we’re looking at 745, then 740, both of which align with key moving averages and GEX. The Keltner channels generally look bullish, which leads to our primary scenario:
-Primary scenario: QQQ holds any 2-3% pullback targeting 740 and resumes the climb toward 775.
-Alternative scenario: QQQ closes above 760 and begins a strong, trending move toward 775, no pullbacks allowed.
Key Levels: Bullish above 760 targeting 765, 770, 775. Bearish below 760 targeting 753, 750.
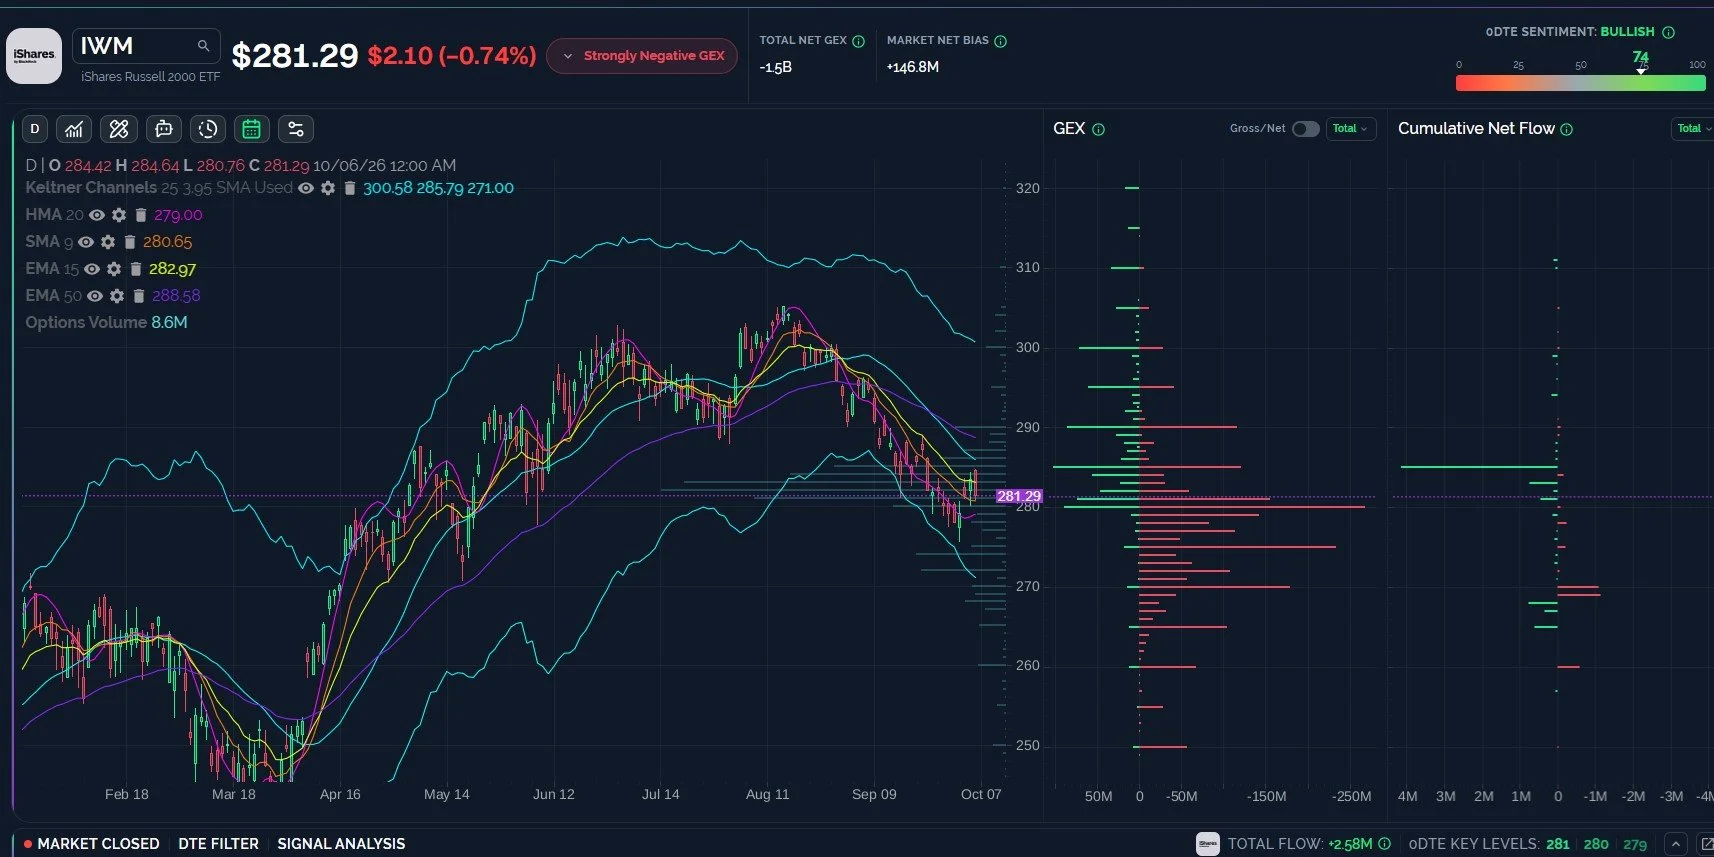
IWM is Still Looking Negative, 270 may be Next WIthout a Close Over 283
IWM is worrisome in that it hasn’t yet broken the downtrend sufficiently. Today’s divergent red candle doesn’t help, either. The Keltners are pointing lower , signaling a strong downtrend, and 270 may be next, if the lower Keltner has its way. 280 is a key spot in terms of GEX and the 9 SMA, so bulls want to see 280 held, allowing a move back to 290. IWM is certainly a short squeeze candidate from a number of contrarian data points, ranging from the extreme negative net GEX to the percentage of shares short, but watching the price action will tell us if anything is actually going to happen along those lines.
-Primary scenario: IWM briefly dips below 280 to retest the HMA at 279, then recovers toward 285.
-Alternative scenario: IWM drops to 270, small caps become smaller caps, then we see a bounce back to retake 280.
Key Levels: Bullish above 280 targeting 285, 290. Bearish below 280 targeting 275, 270.
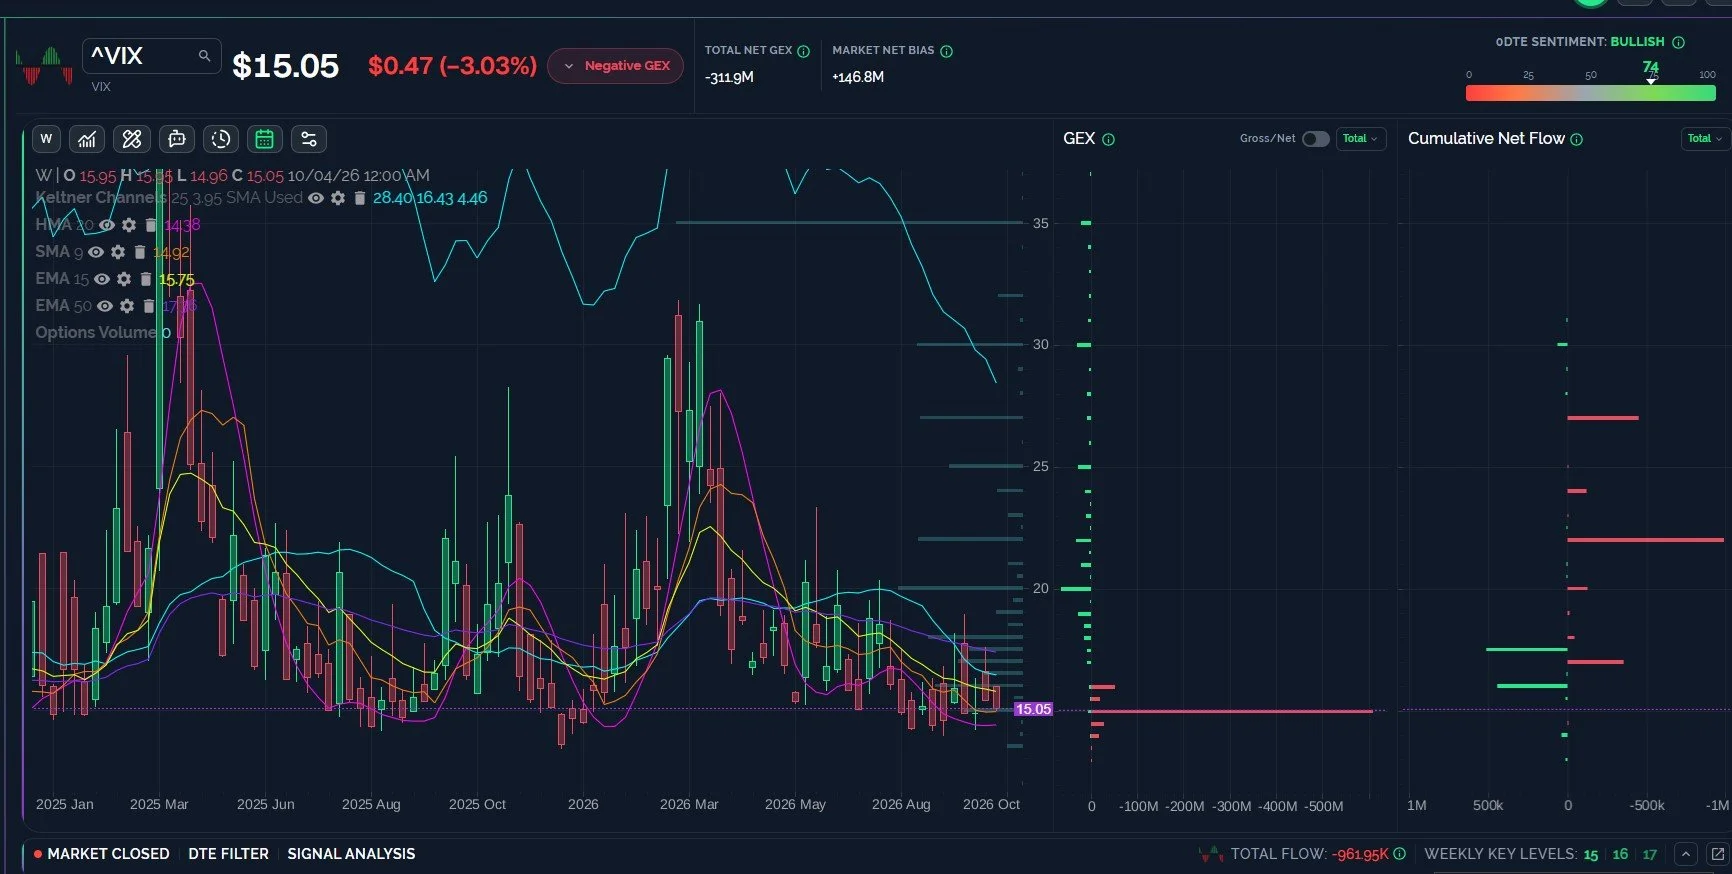
The VIX Holds Above the 9 SMA, Risk to 14.4 Unless 15.7 is Retaken
VX futures appeared to capitulate today, which may be a sign that the VIX is finally bottoming. We also saw 15 tested, which I’ve wanted to see since late last week. The test of 15 brings the VIX back toward the lower support area we’ve seen most of this year, also retesting the weekly 9 SMA at 14.92, which has flattened and could potentially start turning higher. The weekly HMA at 14.38 might be the next target if we see sub-15 levels again in coming days, but the huge negative GEX cluster at 15 suggests we might not make it that low. The VIX needs above 15.7 to begin looking more constructive for volatility bulls, but even getting above 15.7 may only see a rise to 17. Moving above 17 brings 20 into focus. Note that we did see big volume at the 35 strike today, so there’s been some interesting action under the surface with the VIX. Even bulls want to hedge when volatility is cheap, right?
-Primary Scenario: The VIX continues trading in a range between 14.5-16 until Bessent runs out of money.
-Secondary Scenario: The VIX moves toward 20, giving bulls one last “easy buy” before a year-end rally to 8000.
Key Levels: Bullish above 15.7 targeting 17, 20. Bearish below 15.7 targeting 15, 14.4.
Join The Discussion
Non-subscribers can join our great Discord community with all of its experienced traders by clicking Community on our homepage. First-time guests get a free 7-day trial of the premium Discord channels, where we talk through what is happening in real time.
Our YouTube videos can be viewed by clicking Community at the top of our homepage to find the channel link. We posted a new YouTube video tonight discussing major indices as well as some individual stocks, so check it out!
Join our livestream by clicking the link on our homepage every day around 10:30am ET, and you can replay the most recent one any time before the next one begins. We also post a link in Discord when we’re ready to start.
We now have a live demo on our homepage for those who want to explore the main sections of our website, so we invite non-members to check it out!
Thanks for being part of our community and know that we invite and appreciate your feedback!
The information provided by Geeks of Finance LLC is for educational purposes only and is not intended to be, nor should be construed as, an offer, recommendation or solicitation to buy or sell any security or instrument or to participate in any transaction or activity. Please view our Investment Adviser Disclaimer and Risk Disclosure.
