
VIX Expiration & Earnings Season
As we approach monthly VIX expiration in the morning, we see a narrowing of the GEX picture, with 17 and 18 representing the largest net GEX clusters expiring. This is toward the lower end of the previously indicated 17-20 range, so we aren’t surprised by the outcome. What happens next could be interesting: We have some big earnings reports after the bell Wednesday, and the VIX has a potential setup to spike toward 20. Overall, it’s entirely possible a low was set last Friday, so we await more information regarding how another drop might materialize and whether or not we make a higher or lower low. Immediate continuation higher (beyond 7550 SPX, as one example) likely takes a lower low off the table. We will discuss these levels in the newsletter tonight.
Members save $300 on the annual Portfolio Manager plan with code SUMMER26 at checkout, which will run a few more days.
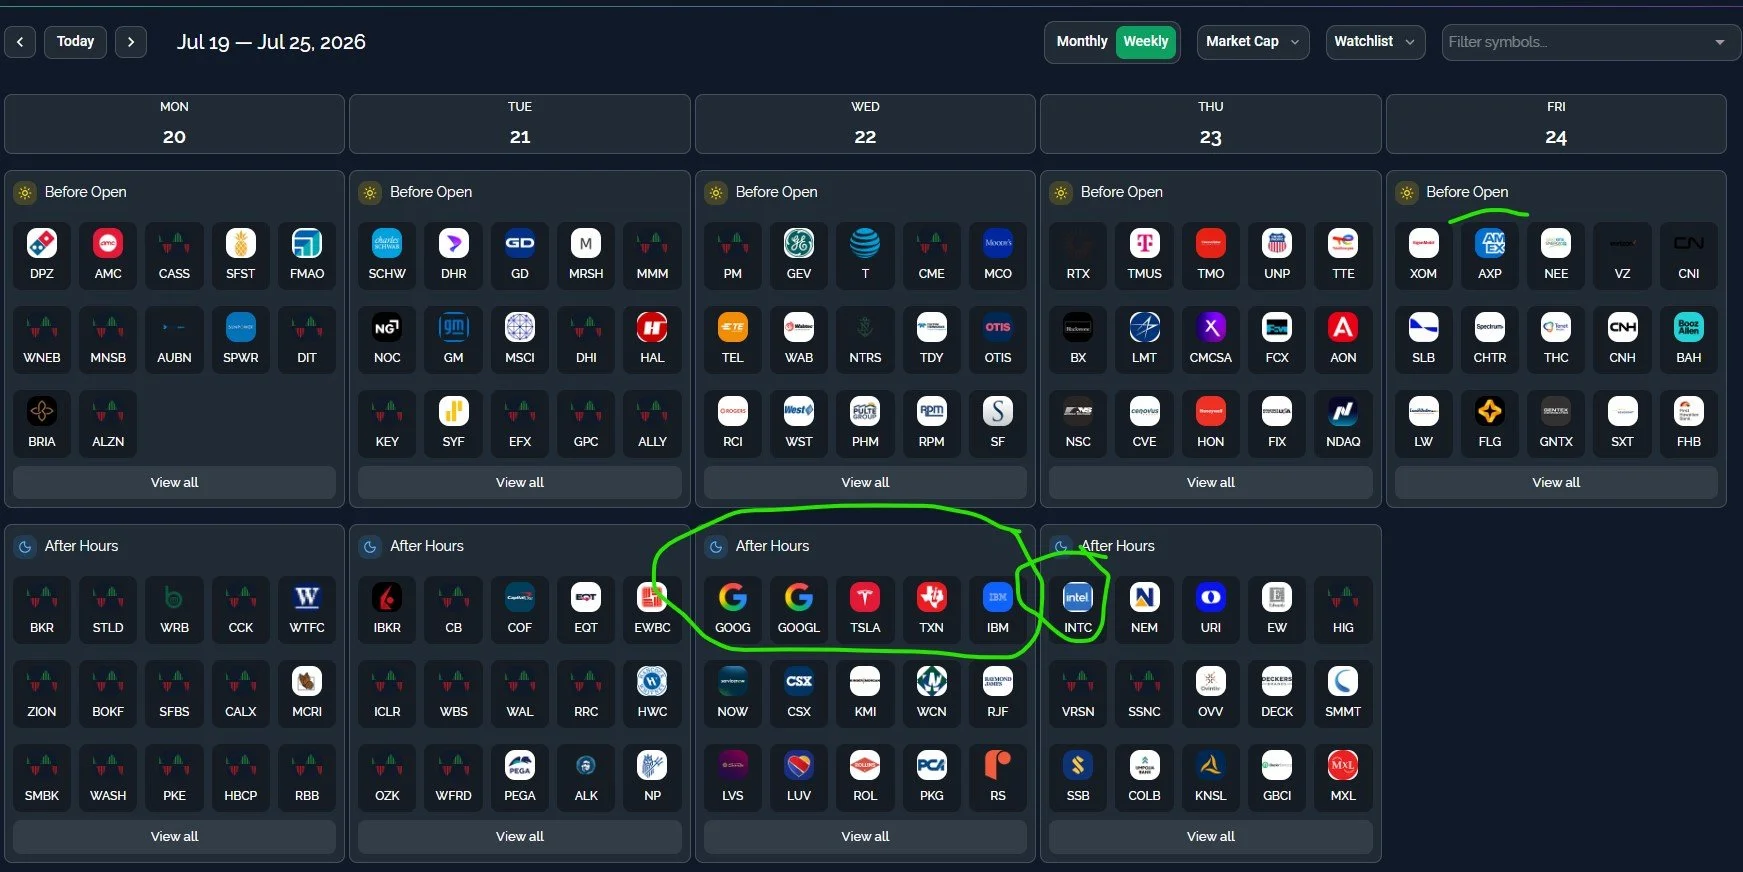
Big Tech Kicks Off Earnings (And Some Big Financials, Transports)
While the transports may only be of interest to the Dow theorists out there, the broader market may be impacted by GOOGL and TSLA tomorrow after the closing bell, with TXN and IBM potentially having a lesser impact on semis and software. Then Thursday we see INTC, so we are entering the gauntlet of Q2 earnings. We typically don’t trade individual stocks going into earnings, but surprises can certainly impact the broader indices, and sometimes we see opportunities created by big drops or rallies following earnings reports. Our Geek Earnings calendar is comprehensive and leads back to the GEX picture associated with each ticker, when available.
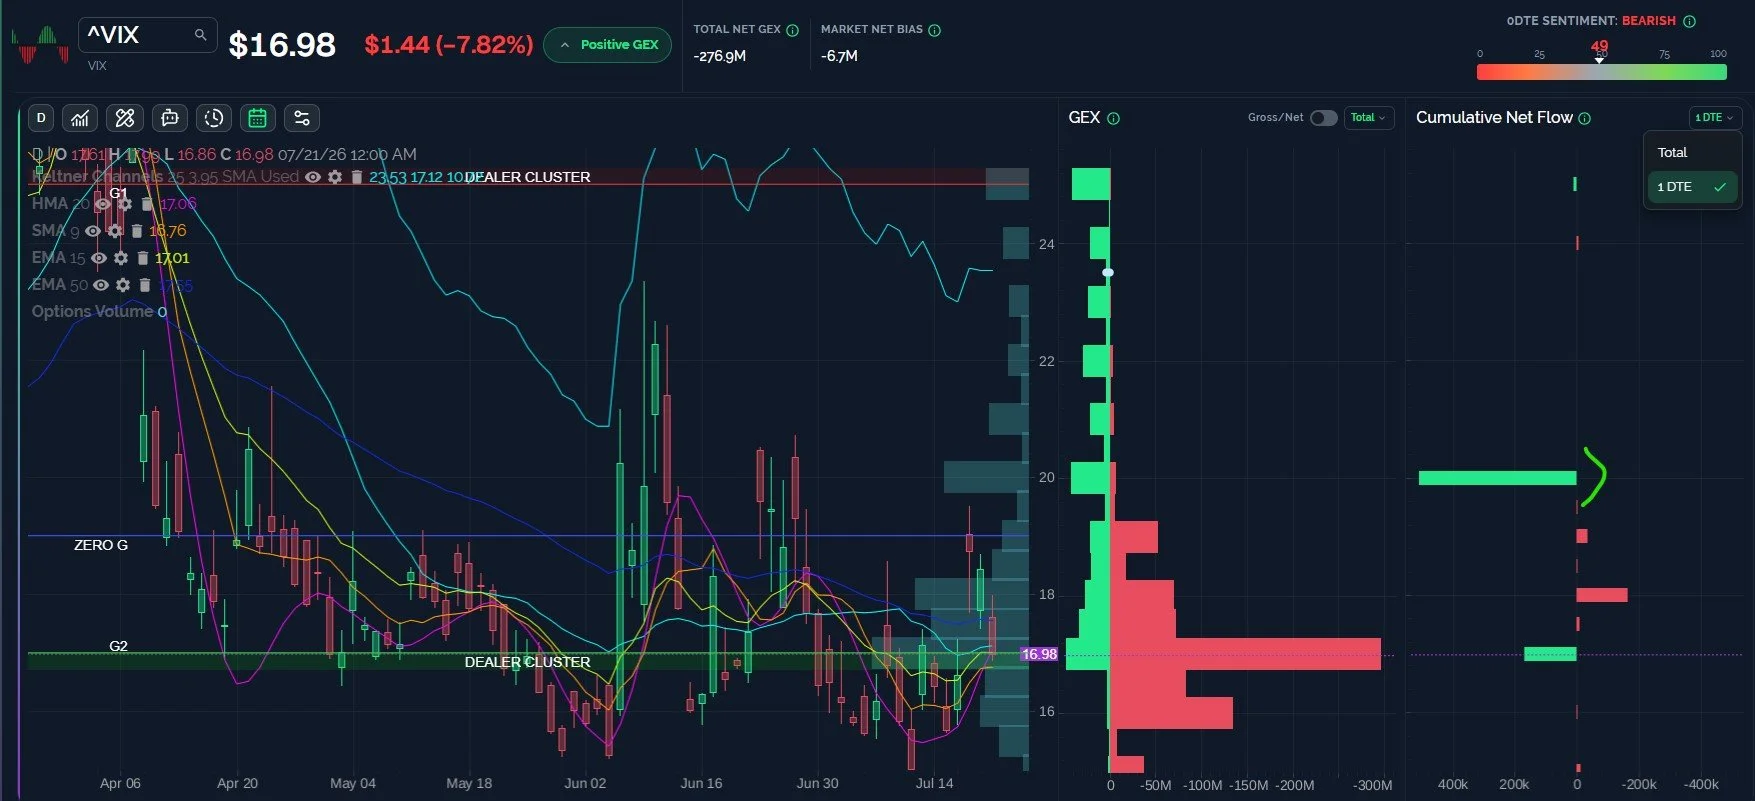
The VIX Shows Potential For A Spike, VOlatility Can Expand Post-Expiration
The VIX appears likely to see its monthly options expire between the 17 and 18 strikes premarket Wednesday, barring a risk event out of left field. What happens next remains to be seen, but with the VIX moving down in 3 days from 19.5 to below 17, the risk/reward is once again beginning to shift toward either sideways or higher for the VIX, if the range we’ve seen over the last year or so remains valid. The GEX picture does indicate at least some potential to approach the 16 area, but we still see odds of a spike increasing over 17.06, the daily HMA. The highlighted green bar next to the 20 strike indicates positive option activity (call buying, put selling, etc), which brings attention to 20 as a potential target, and we’ll address one indicator that aligns with 20 in the next paragraph.
Key levels: Bullish (for the VIX, not your SPX lotto calls) above 17 targeting 20, bearish with limited downside below 17 targeting 16.
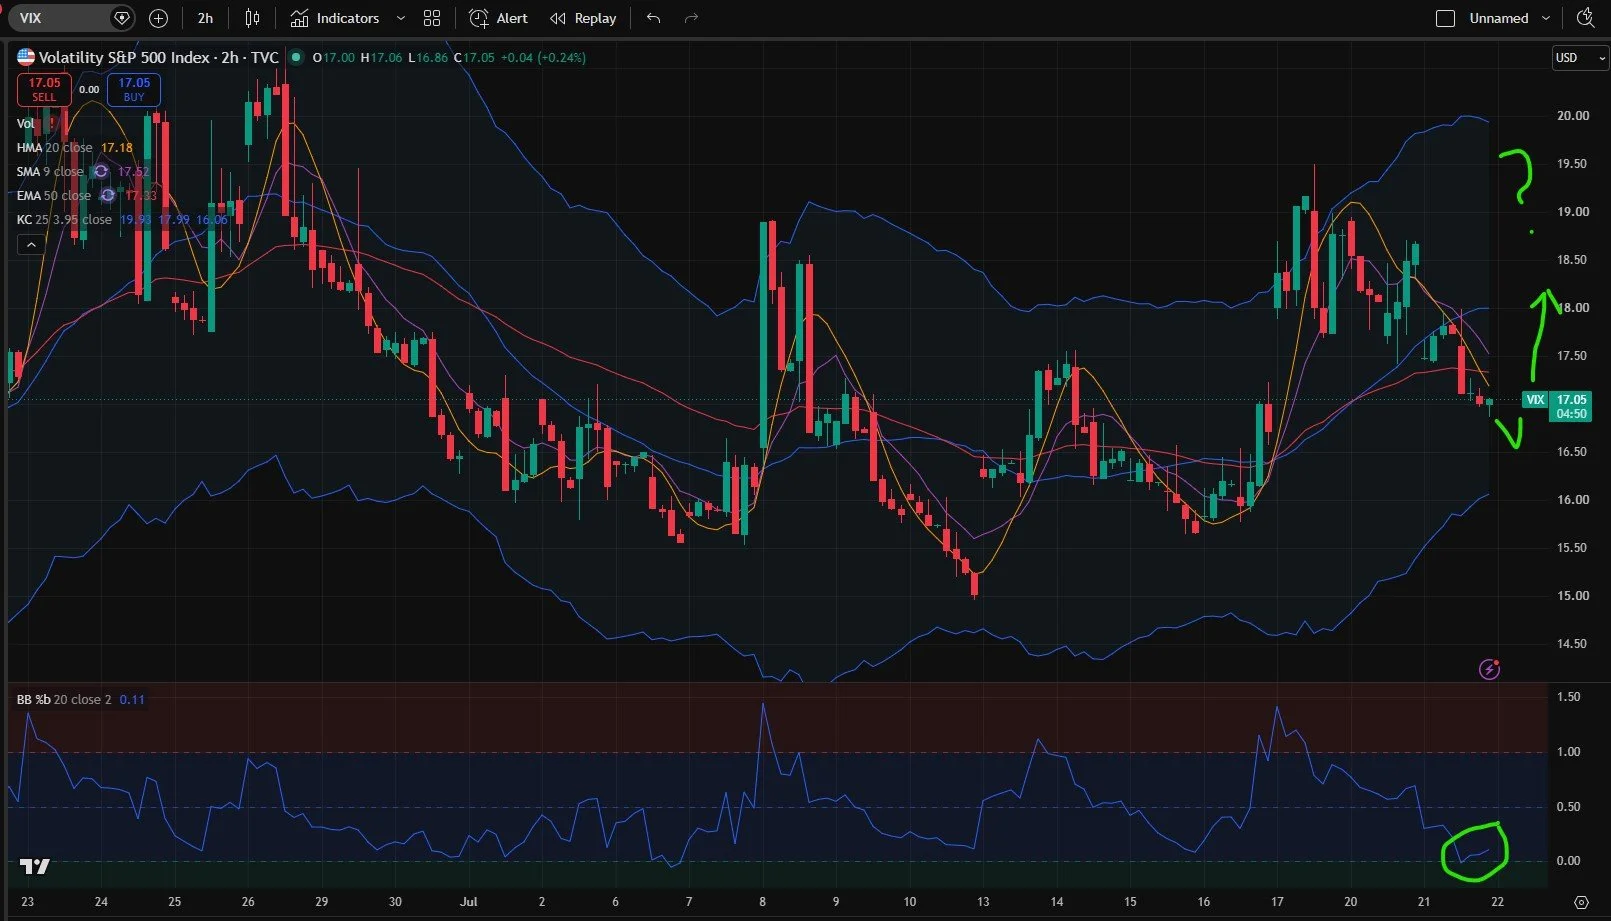
The VIX 2-Hour Chart Is Oversold, Pointing Higher
The 2-hour Keltner channels in particular look bullish for the VIX, with this gap fill bringing the VIX right to a point where we wouldn’t be surprised by a spike toward 20, nicely aligned with the upper Keltner channel. The %b indicator is buried to the zero line as well, a potential contrarian bottoming signal. We could still see the VIX drop toward 16 without invalidating the setup for a spike, but we’ll watch for the crossover above the HMA, with the 2-hour and daily charts both very close to matching at 17.06 and 17.18. I personally place greater significance on lines that meet across different timeframes.
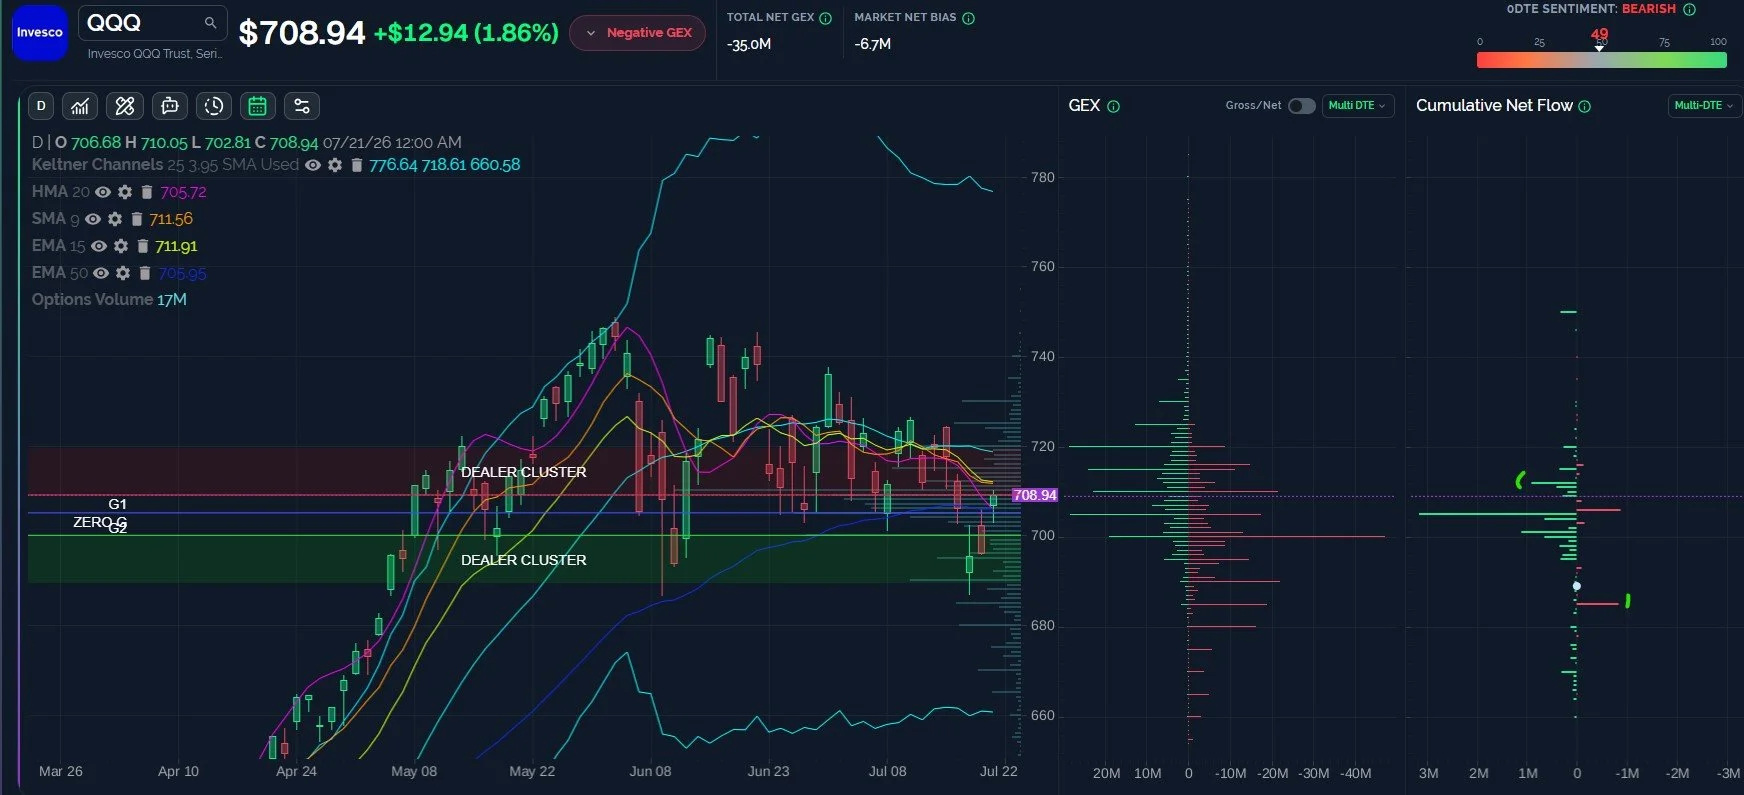
QQQ GEX Is Mostly Between 680-720 This Week
As long as QQQ is above 700, we lean toward higher targets being in focus first, and above 712 can reach 720. The GEX picture this week indicates most of the net and gross GEX sits between 680 and 720, and flow was mixed today as well, so we await breaks of levels mentioned to raise our conviction directionally.
Key Levels: Bullish above 712 targeting 720, bearish below 700 targeting 680.
SPX May See Significant Resistance At 7530-7550
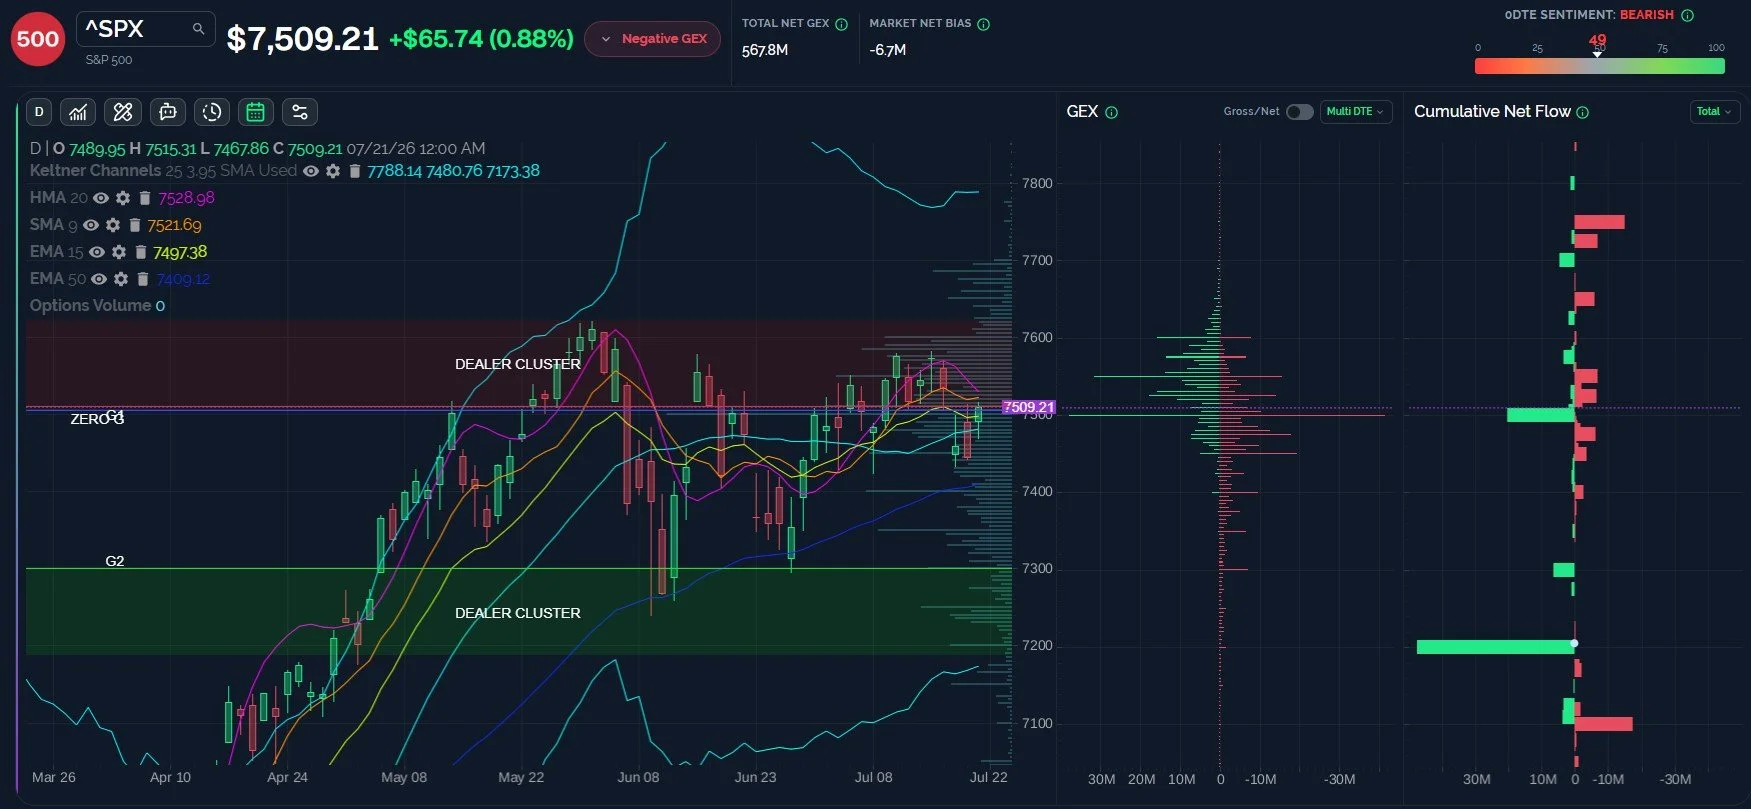
SPX’s GEX picture isn’t bearish, per se, and this week we do see GEX concentrated between 7450-7550, though notable clusters do extend to 7600. The 9 SMA and HMA between 7522-7529 may be the first significant resistance spot on continuation higher, and 7550 beyond that zone. We remain open to flipping more bullish on a break of 7550, but until then, a “sell the rip” opportunity may present itself with risk of seeing a fade down to 7450 or lower if 7500 is lost again.
Key Levels: Bullish above 7530 targeting 7550, bearish below 7500 targeting 7475, then 7450.
SPX Net GEX This Week Is Still Negative
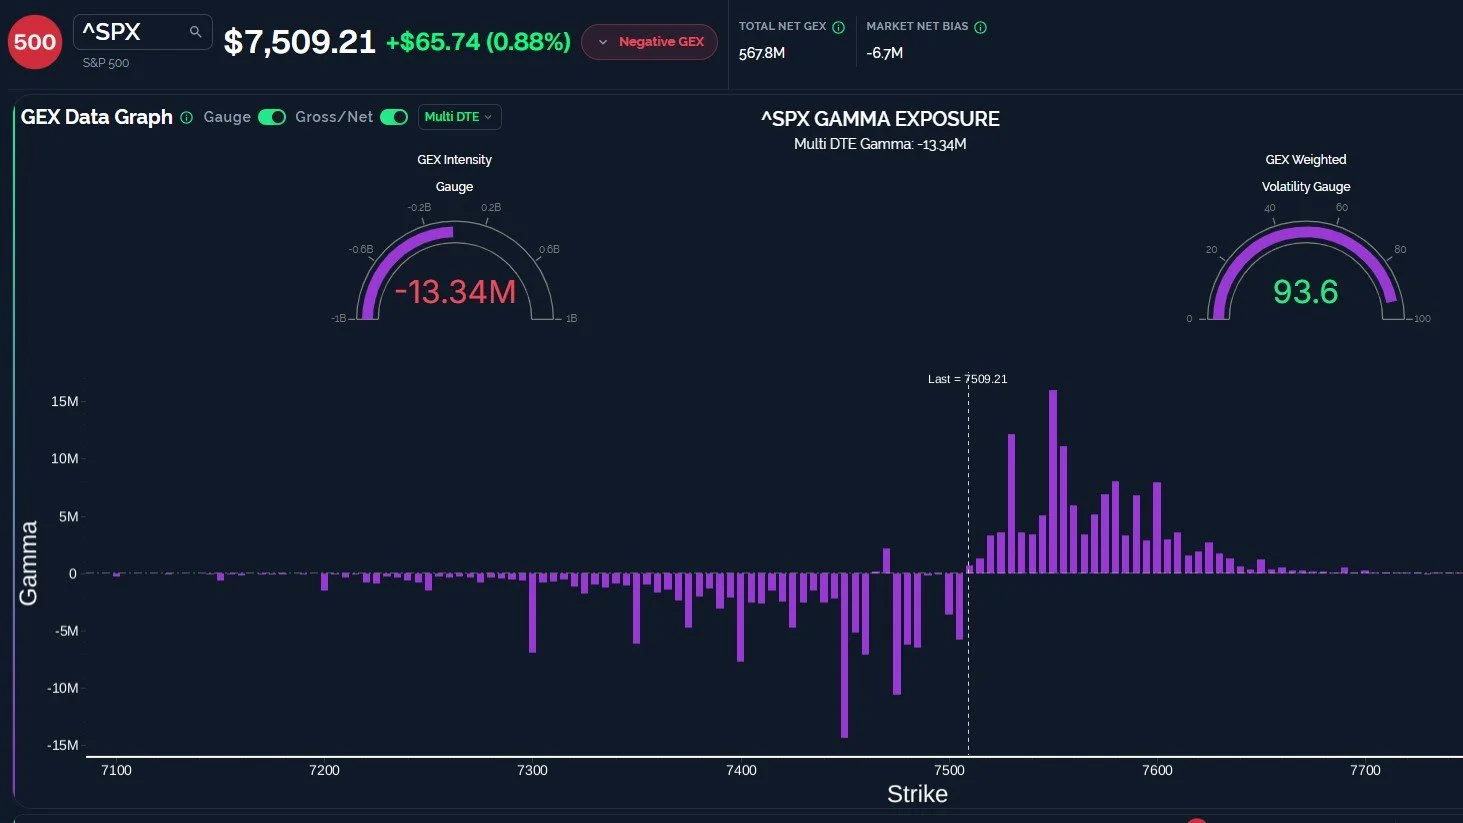
The chart and GEX above reflects gross GEX, but the net GEX picture below reveals existing downside risk with a negative total GEX picture for the week. While the largest individual clusters are spread from 7450 through 7550, you can see a steady amount of negative GEX all the way down to the dreaded (well, dreaded by max leveraged longs) 7300. I like a good sale, personally. I'll buy holiday decorations after the holiday, as an example. Who am I kidding- I don’t buy holiday decorations.
Join The Discussion
We hope you will join us in Discord this week, where we share some observations every day for free.
Our YouTube videos can be viewed by clicking Community at the top of our homepage to find our YouTube channel link.
Non-subscribers can join through Community on our homepage. First-time guests get a free 7-day trial of the premium Discord channels, where we talk through what is happening in real time.
Join our livestream by clicking the link on our homepage every day around 10:30am ET, and you can replay the most recent one any time before the next one begins.
Thanks for being part of our community and know that we invite and appreciate your feedback!
The information provided by Geeks of Finance LLC is for educational purposes only and is not intended to be, nor should be construed as, an offer, recommendation or solicitation to buy or sell any security or instrument or to participate in any transaction or activity. Please view our Investment Adviser Disclaimer and Risk Disclosure.
