
Earnings Volatility Ahead?
Big tech earnings kicked off after the bell Wednesday with GOOGL, TSLA, TXN, and IBM reporting, and INTC reporting Thursday. After hours action has been soft so far, and SPX’s close just below 7500 raises the possibility that we see some post-VIX expiration volatility that we’ve been discussing. GEX for SPX especially is still skewed higher, so we view any dip that stays above the 7300 area as broader consolidation before a move higher. Let’s look more closely at potential triggers for a move in either direction.
Members save $300 on the annual Portfolio Manager plan with code SUMMER26 at checkout, which will run a few more days.
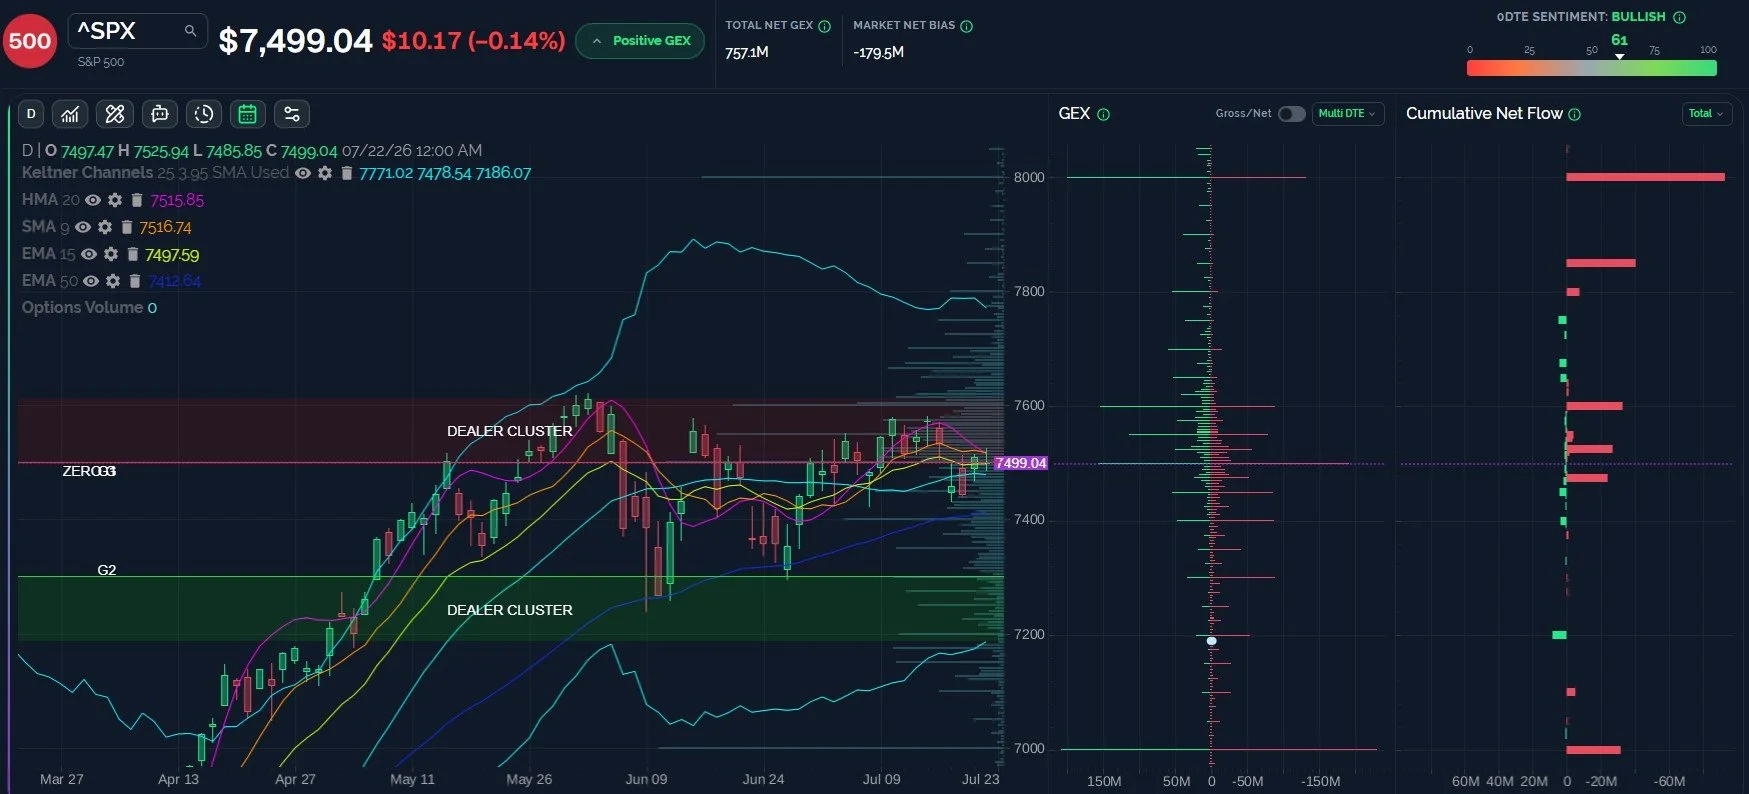
SPX: Cumulative Net Flow Broadly Negative, GEX Leans Positive?
Today saw large positive option flow at 7550 compared to flow at any other strike for this week’s expiration, but when compared to the total cumulative net flow (loosely synonymous with option flow), it was a blip on the radar of an overwhelmingly negative picture. SPX looked above the HMA but failed, closing just below 7500. If 7500 holds as resistance, we’re looking at 7450, then 7400.
Now for the bullish side: Gross GEX shows most of the GEX is between 7500-7600, and 8000 looks like a big potential target for later in the year, despite the negative option flow visible today. If we see further downside, the current picture appears to tilt the odds toward an attractive dip buy down to 7200, and 8000 is 10-12% away from that lowest level within the dealer cluster zone, which seems attainable. We may see 7550 this week if SPX can stay above 7500 tomorrow and/or Friday.
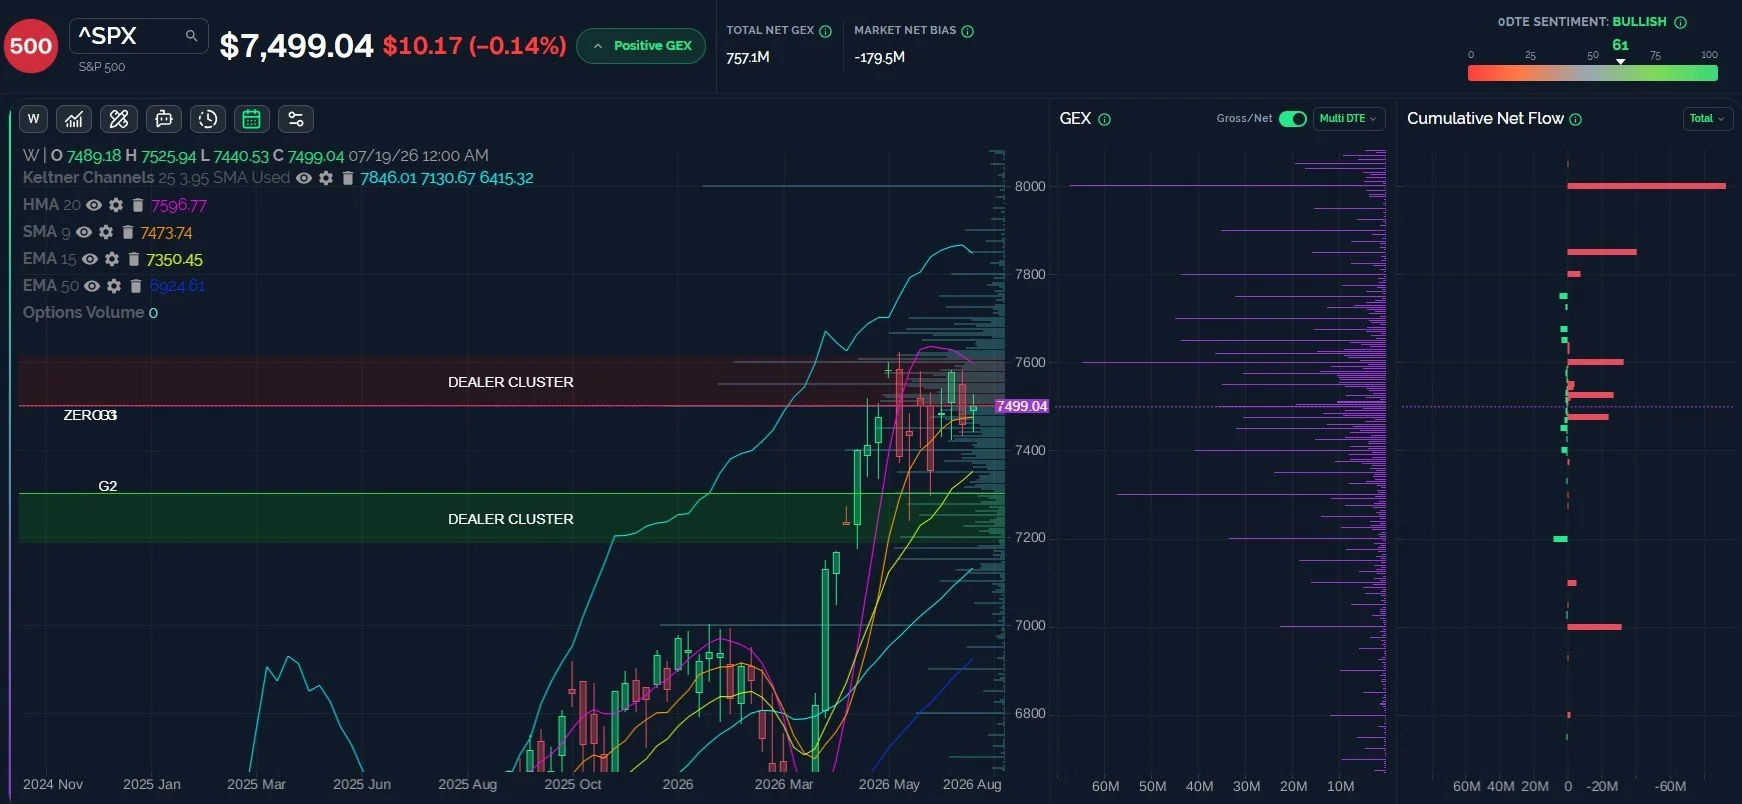
SPX Weekly Picture+Net GEX Leans Positive: 7600 Is The Key
We pointed out some bullish and bearish points using the daily chart with gross GEX above, but now let’s look at the weekly picture with net GEX shown. The GEX picture is tilted toward the positive side, with most of the net GEX concentrated between 7300 and 8000. It seems crazy to say 8000, but once again, that’s 4% away currently, and not even 10% away from 7300. The 9 SMA has been a battleground this week, currently at 7473.74 (read that again?), but in the short run, my attention is on the declining weekly HMA at 7596.77. Unless SPX can close above 7600, I think the odds favor more consolidation, and likely a VIX spike since we aren’t far away from a major support area for the VIX.
Key levels: Bullish above 7500 targeting 7550, then 7600. Bearish below 7473 targeting 7450-7400 initially.
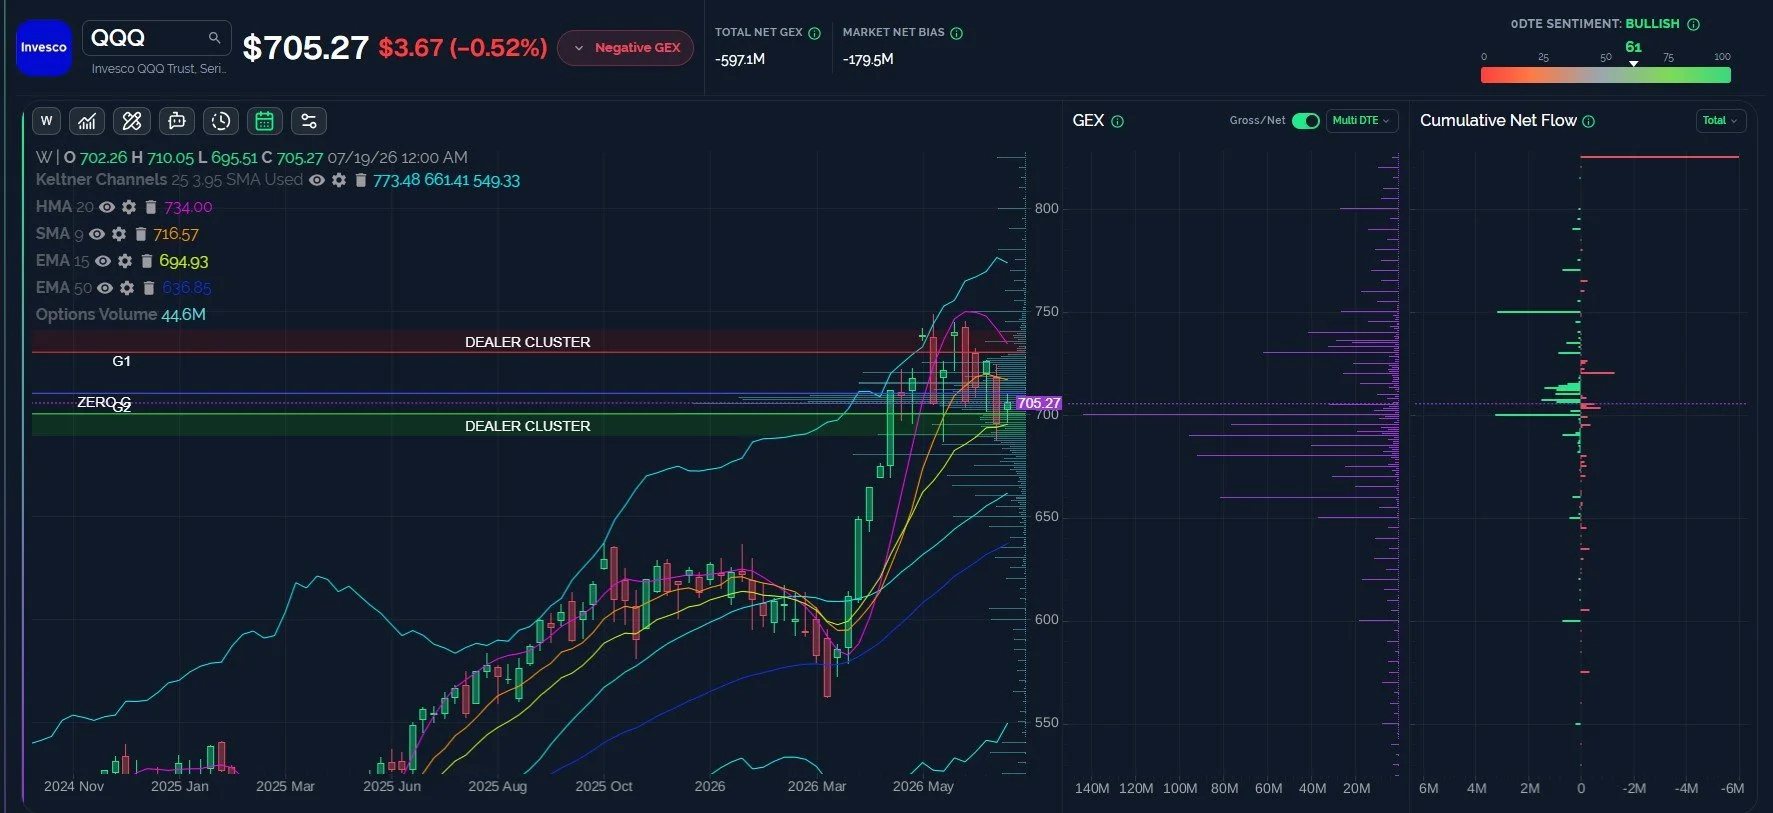
QQQ Net GEX Still Points Lower, But Test Of 730 Is Possible If Upside Continues
Most of QQQ’s net GEX resides between 650-700, which is a more negative picture than SPX. It’s not surprising to see a different picture between the two, though we often see disagreements resolve in favor of SPX. QQQ continues to hold above 700 since its retest of the 15 EMA at 694.93, and as long as QQQ is above 700, a retest of 630 may be in store, roughly where the declining HMA will presumably be within a day or two (currently it’s at 734). A loss of 693 on a daily close risks 680, then 660.
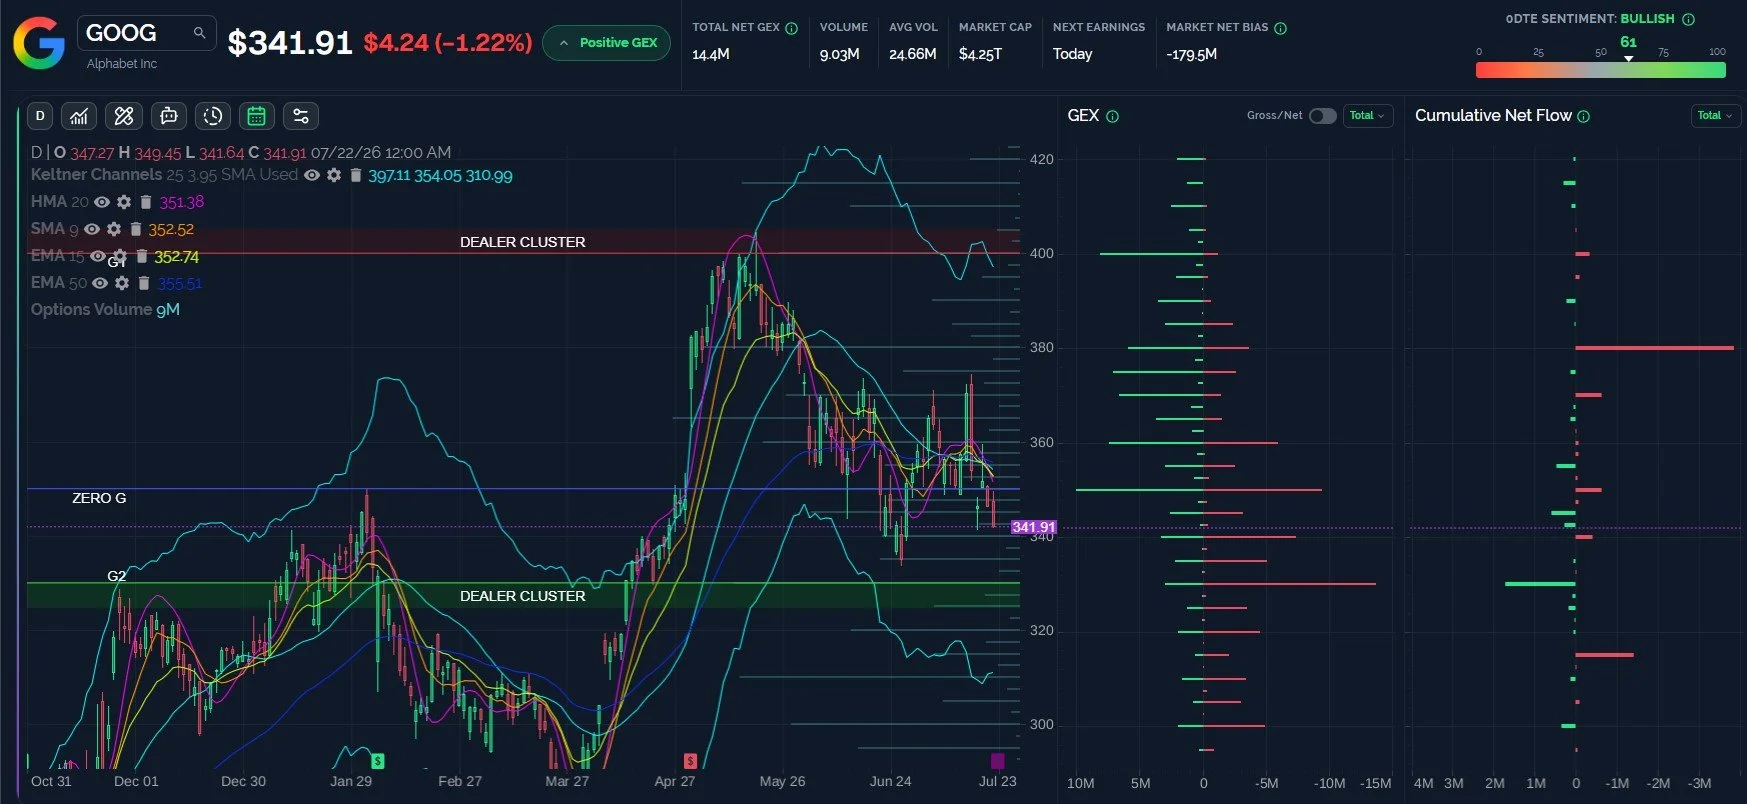
GOOG Drops To The Lower Dealer Cluster Zone After Hours
Earnings introduces an element of uncertainty that GEX cannot completely account for, but let’s take a quick look at the GEX picture as it stood immediately prior to GOOG’s earnings release. GOOG closed below a big GEX area at 350, which looked concerning even before the negative reaction from the market. A quick plunge to 325 took place, recovered to retest 350, then dropped again, currently at 333. This area holds interest as a potential resistance-turned-support area, and the lower Keltner on the daily chart is not far from 310. If we lose 325 again, we may see new lows relative to recent lows, but we may have a buying opportunity at those lower levels. We’ll want to see how the GEX picture shifts Thursday.
Key Levels: Bullish above 325 targeting 350, then 360. Bearish below 325 targeting 310.
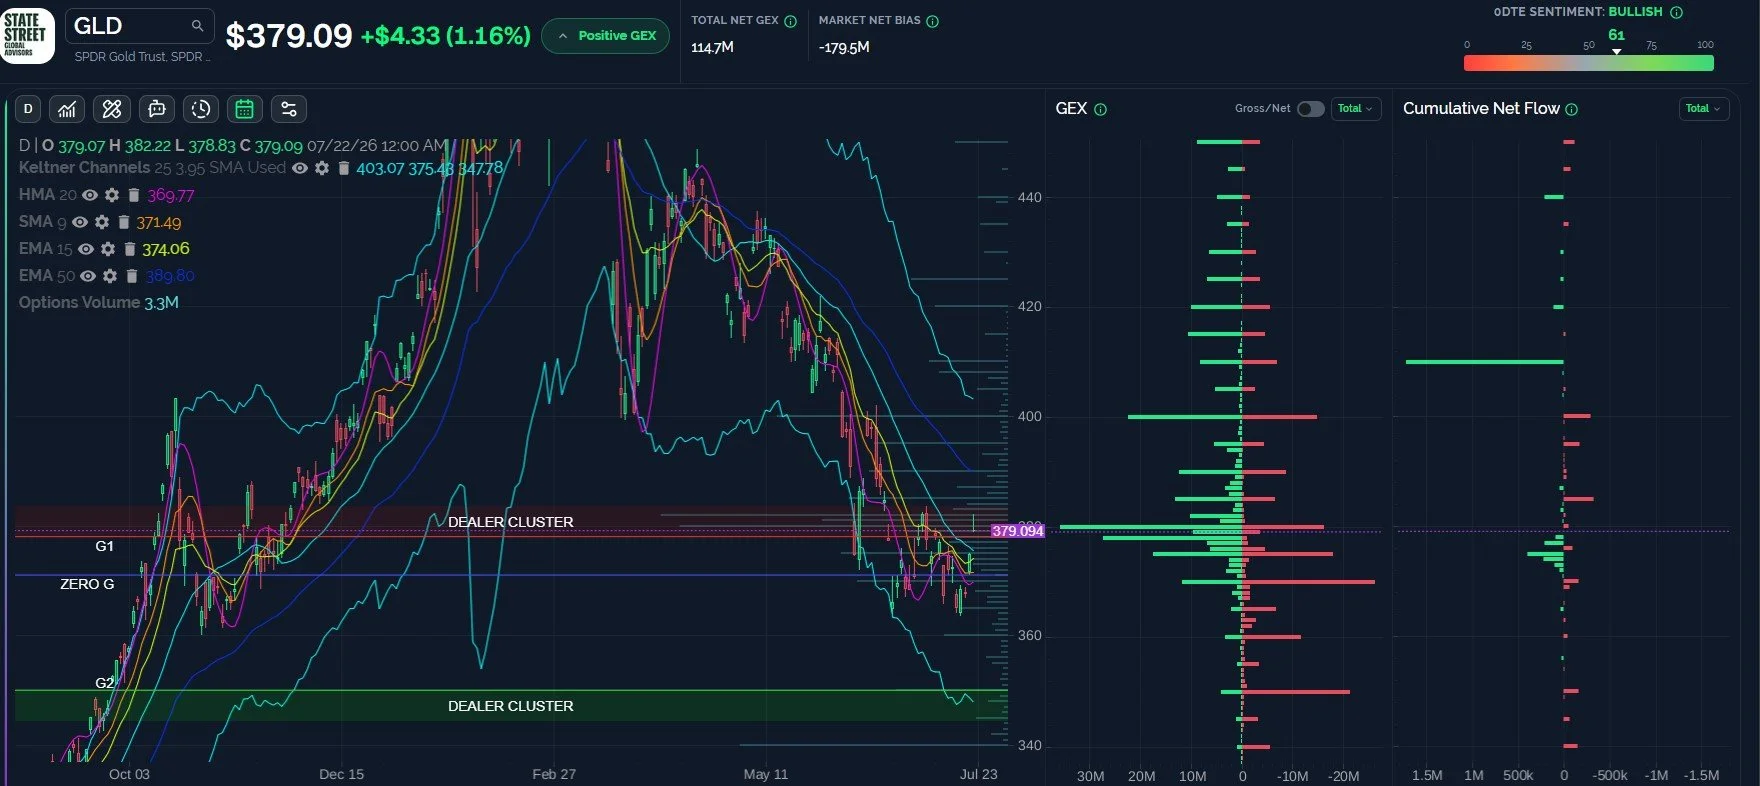
GLD May Reach 400 If It Can Close Over 380
GLD has staged an impressive rally this week, testing the 380 area today before closing just below 380. GEX has climbed into positive territory, and we see positive cumulative net flow at the 410 strike. 400 currently appears to be a solid upside target if GLD can hold above 380, though we should note that the daily chart shows the Keltners are still in a steep downtrend, and even the weekly Keltners are closer to 350, where we see the lower dealer cluster zone. We will watch levels closely knowing we have risk in both directions from this area.
Key Levels: Bullish above 380 targeting 400, bearish below 380 targeting 350-360.
Join The Discussion
We hope you will join us in Discord this week, where we share some observations every day for free.
Our YouTube videos can be viewed by clicking Community at the top of our homepage to find our YouTube channel link. We haven’t posted a video since last week due to travel circumstances, but we hope to post one Thursday!
Non-subscribers can join through Community on our homepage. First-time guests get a free 7-day trial of the premium Discord channels, where we talk through what is happening in real time.
Join our livestream by clicking the link on our homepage every day around 10:30am ET, and you can replay the most recent one any time before the next one begins.
Thanks for being part of our community and know that we invite and appreciate your feedback!
The information provided by Geeks of Finance LLC is for educational purposes only and is not intended to be, nor should be construed as, an offer, recommendation or solicitation to buy or sell any security or instrument or to participate in any transaction or activity. Please view our Investment Adviser Disclaimer and Risk Disclosure.
