
Negative VIX Divergences, SPX Narrows
We can hardly call what we saw today as “weakness” amongst the indices, but we do see continuation of VIX and VVIX divergences as well as some option activity giving a speculative eye toward a potential dip toward 7670-7700, at a minimum. Daily moving average divergences are narrowing while the 1-hour chart is on a sell signal (for now) according to my favorite indicators, so let’s discuss criteria we’ll be watching for clues in either direction as we approach Tuesday’s cash session.
Members save $300 on the annual Portfolio Manager plan with code SUMMER26 at checkout, which will run a few more days.
We also have a new offering for longer-term investors- appropriately named The Investor, featuring valuation analysis, customizable valuation model inputs, and A.I-assisted earnings report data and a lot more, and at a much lower price point than our competitors! Check it out on our homepage (link toward the end of the newsletter).
SPX GEX This Week Suggests 7700-7800 As The Range To Watch
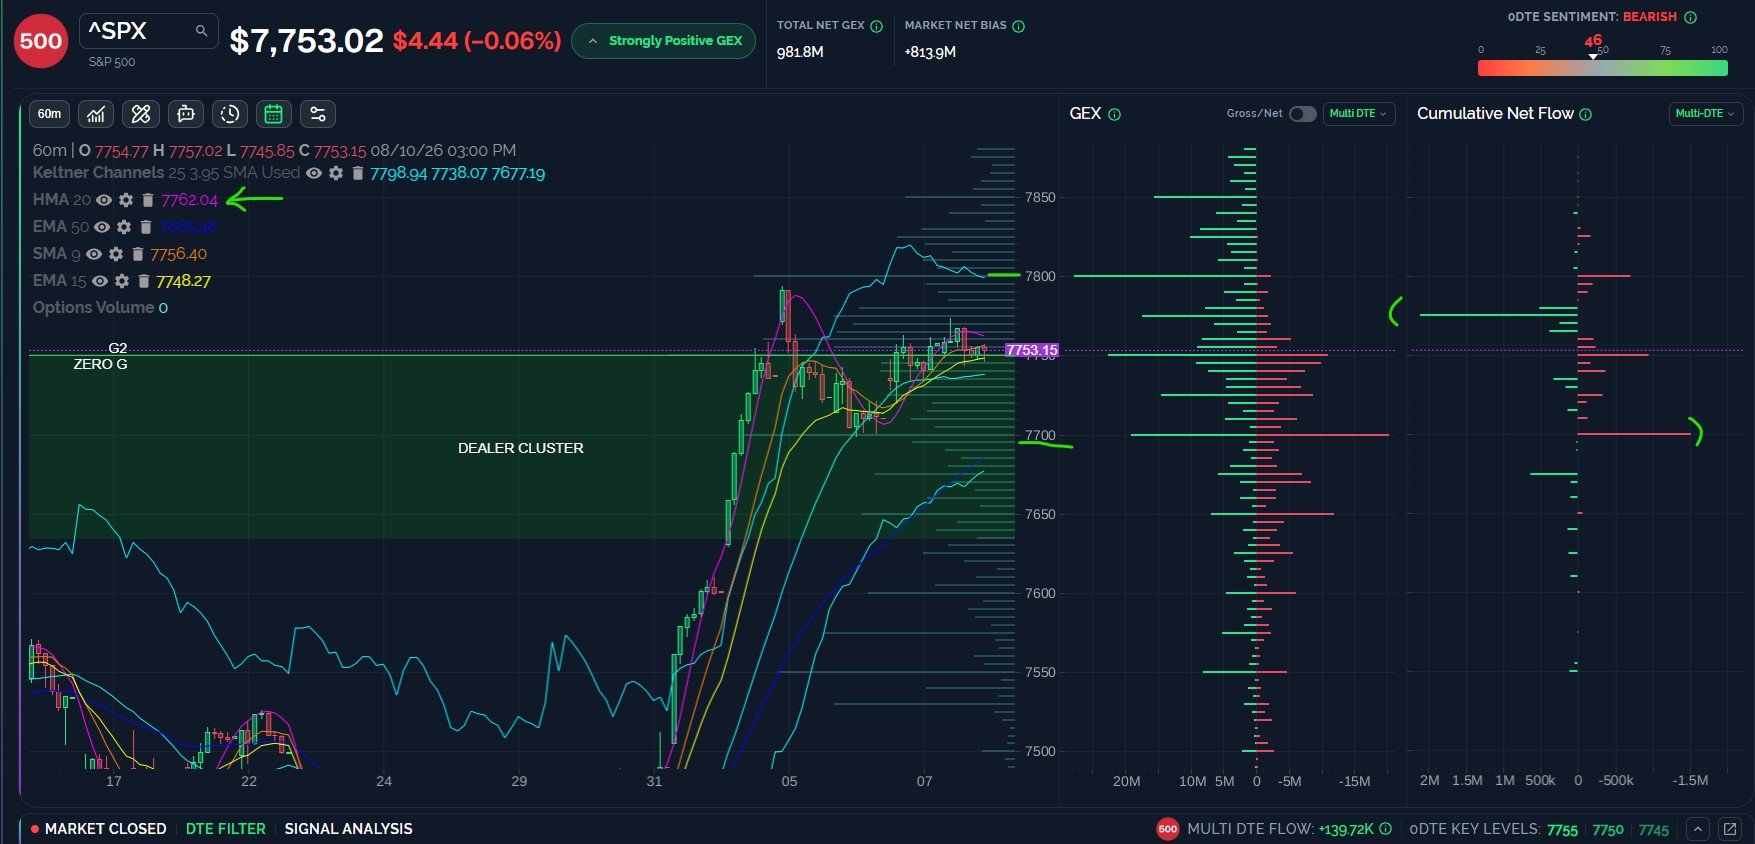
I am displaying the chart using 1-hour candles because I find the 1-hour Keltner channels to match quite well with the largest GEX clusters expiring this week. We see a support “floor” at 7700 with a lot of GEX on both sides, while a large net positive cluster at 7800 marks what I’ll call our initial upside target. As is typical with SPX, today’s close left both sides guessing, spending the latter part of the afternoon below 7750, then shooting just above 7750 to paint a pretty close above the level we want to see hold for continuation to 7800. SPX still closed below the HMA at 7762 though, so we have GEX suggesting continuation higher while some indicators indicate a threat to that upside. Net option activity was elevated at 7700 as well as 7775, not really tilting the odds either way, in our view.
Key Levels: Bullish above 7750 targeting 7800. Bearish below 7750 targeting 7700, then 7670 (more on that next).
Potential Wednesday Low?
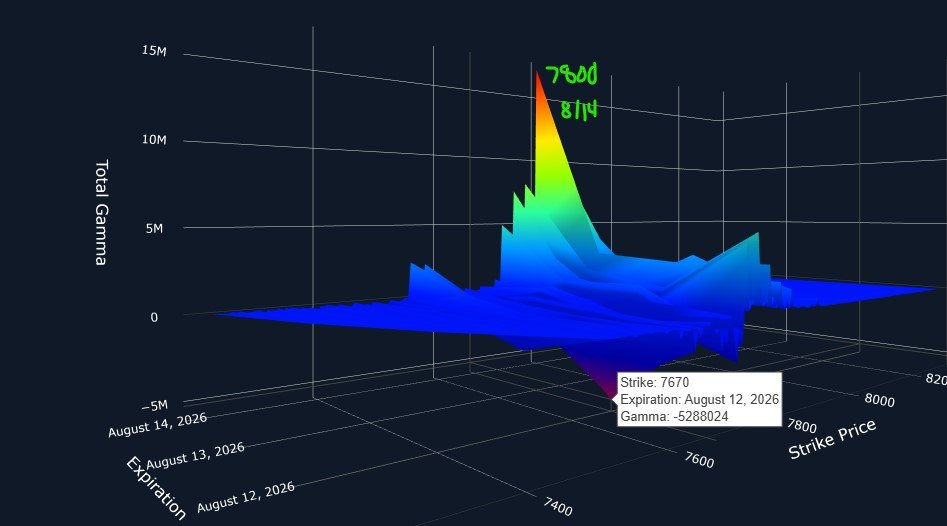
The 3D graph shows some interesting granular detail regarding this week’s GEX clusters: The largest net positive cluster at 7800 mostly expires Friday the 14th, while the largest net negative GEX cluster rests at 7670, expiring Wednesday, coincidentally the same day as the CPI report. It’s important to note that GEX is skewed positively overall, so we tend to treat downside targets like 7670 as potential buying opportunities unless the broader picture shifts more negatively. Given that 7700 is such a big GEX area, if 7670 is indeed going to mark a low this week (or get hit at all), we would expect an intraday rebound to close near 7700 again to keep additional upside potential intact.
QQQ Targets 730-735 If 710 Holds This Week
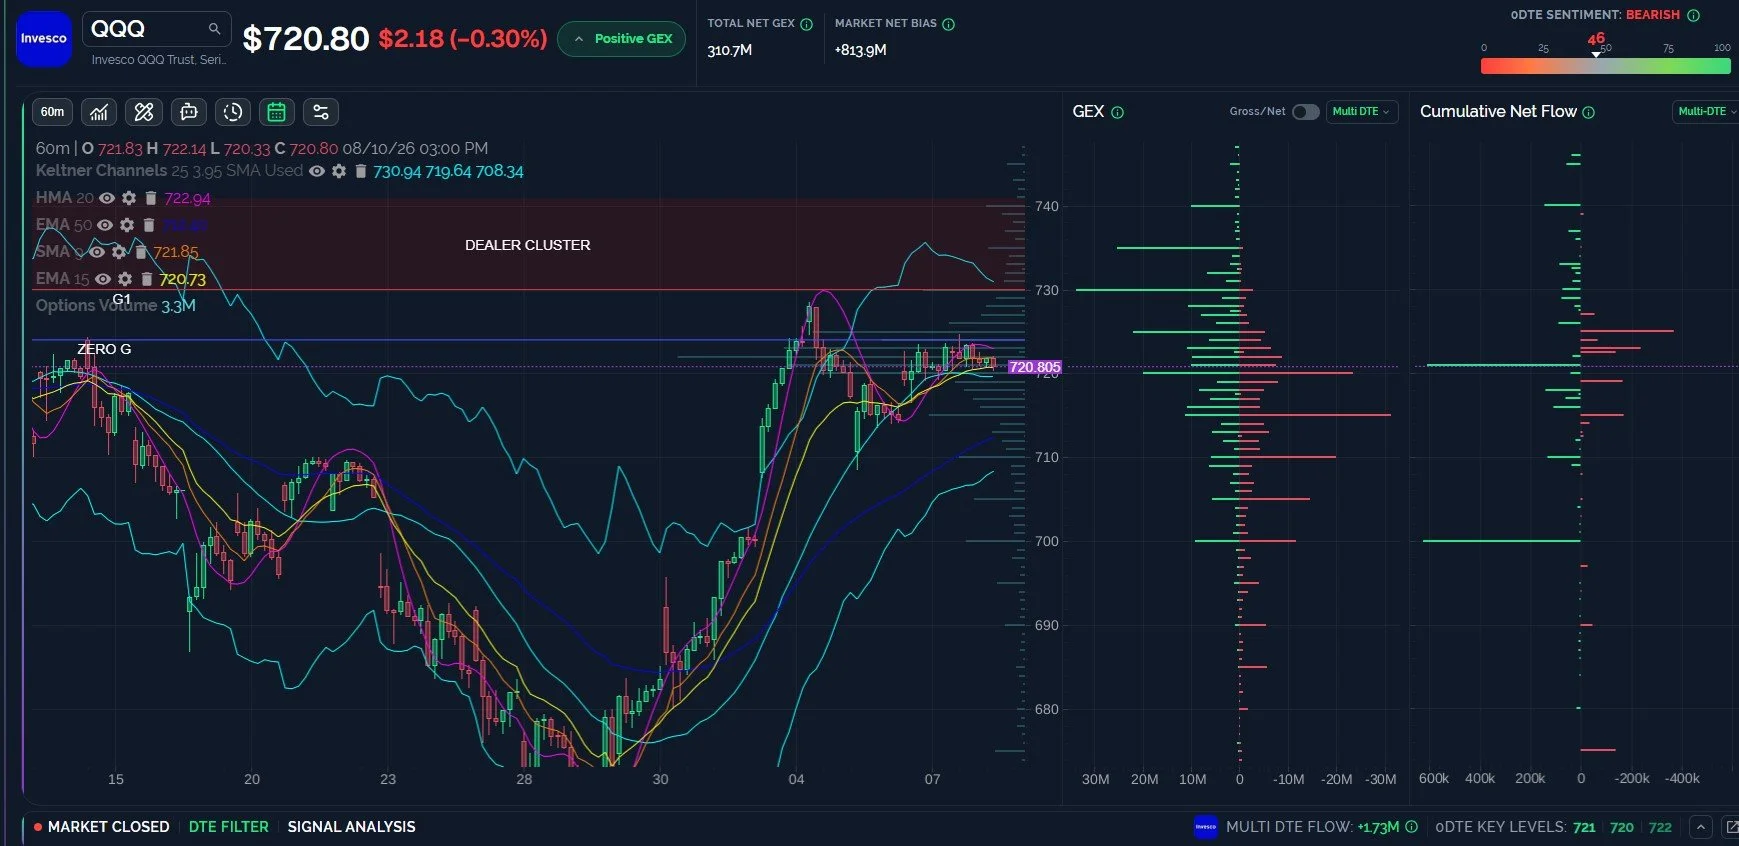
QQQ also closed below its 1-hour HMA at 722.94, tilting short-term odds toward more weakness, though QQQ still holds above the key 720 GEX area and we can never put it past the night crew to buy up futures, so we really need to see where QQQ opens Tuesday. This week shows a likely range of 710-735, with any dip toward the lower end of that range being viewed as a buy in our view, with any rally toward 735 requiring reconsideration of the GEX picture at that time. As long as 700 holds on the downside, we are looking up for QQQ, ultimately.
Key Levels: Bullish above 720 targeting 730-735 this week. Bearish below 720 targeting 710, then 700.
QQQ’s Total GEX Picture Suggests 750 May Be A Target Eventually
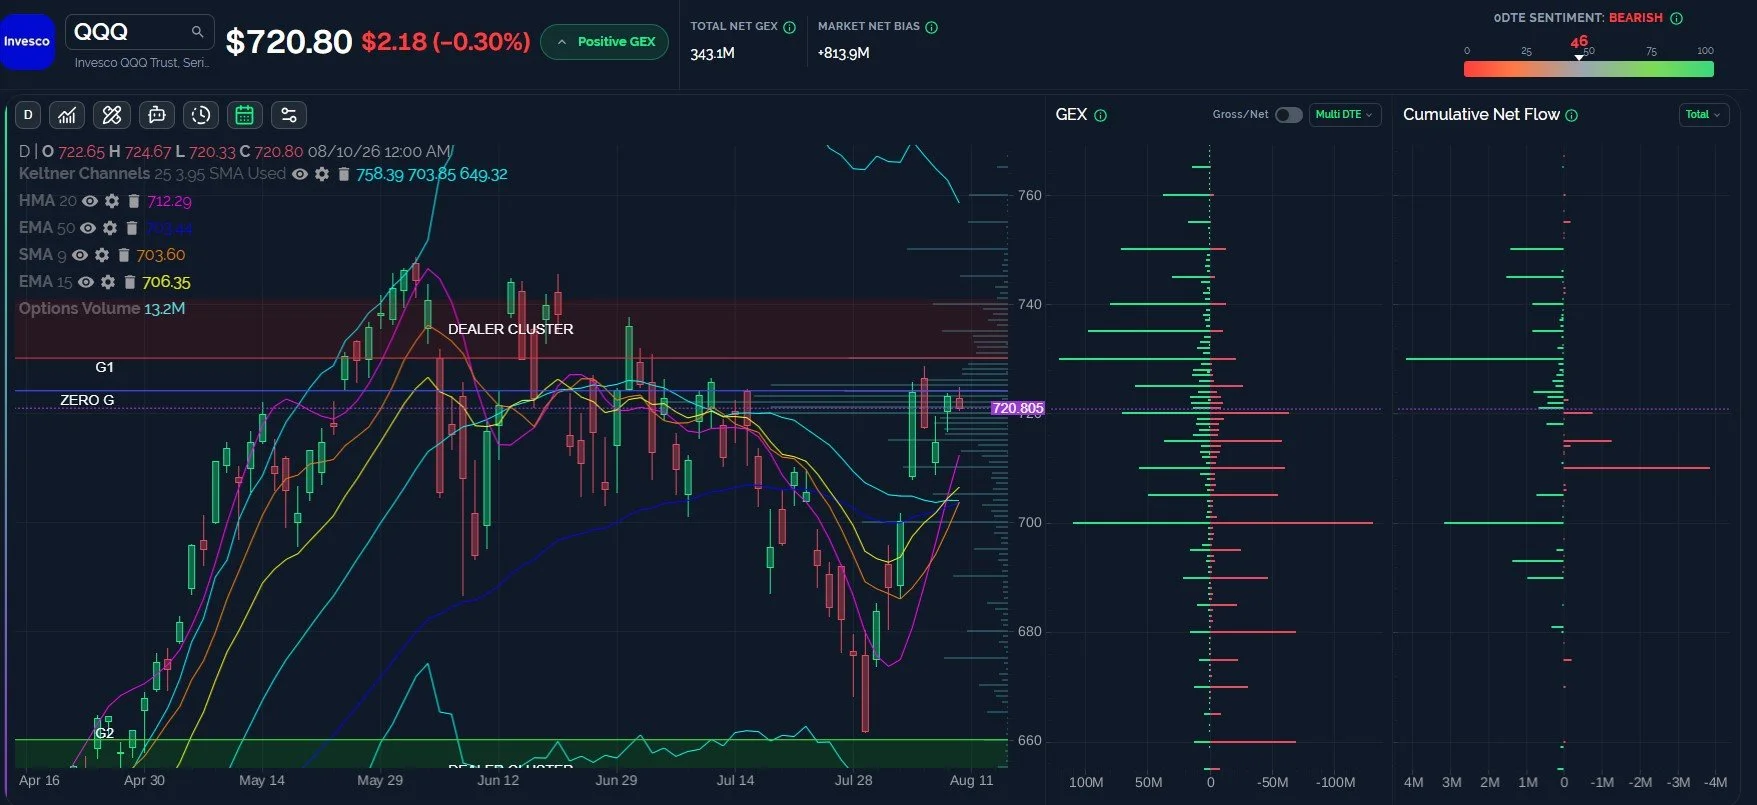
QQQ shifted more bullish Monday, with noteworthy GEX up to 750 visible. We also saw large positive option activity at 735 today. The daily chart looks more positive than the hourly chart, with QQQ holding above 712, the daily HMA.
Let’s go back to the last paragraph where we mention QQQ 710: Not only is that close to the daily HMA at 712, but it’s also close to the 1-hour lower Keltner channel and the weekly HMA and 9 SMA. When I see multiple indicators aligning across various timeframes, I assign a higher level of importance to such levels. So 710 starts to look VERY important to me in maintaining the upside momentum for QQQ. With so much GEX still residing at 700, we can call the 700-710 zone as a chop zone/potential bottoming area with bearish implications below 700.
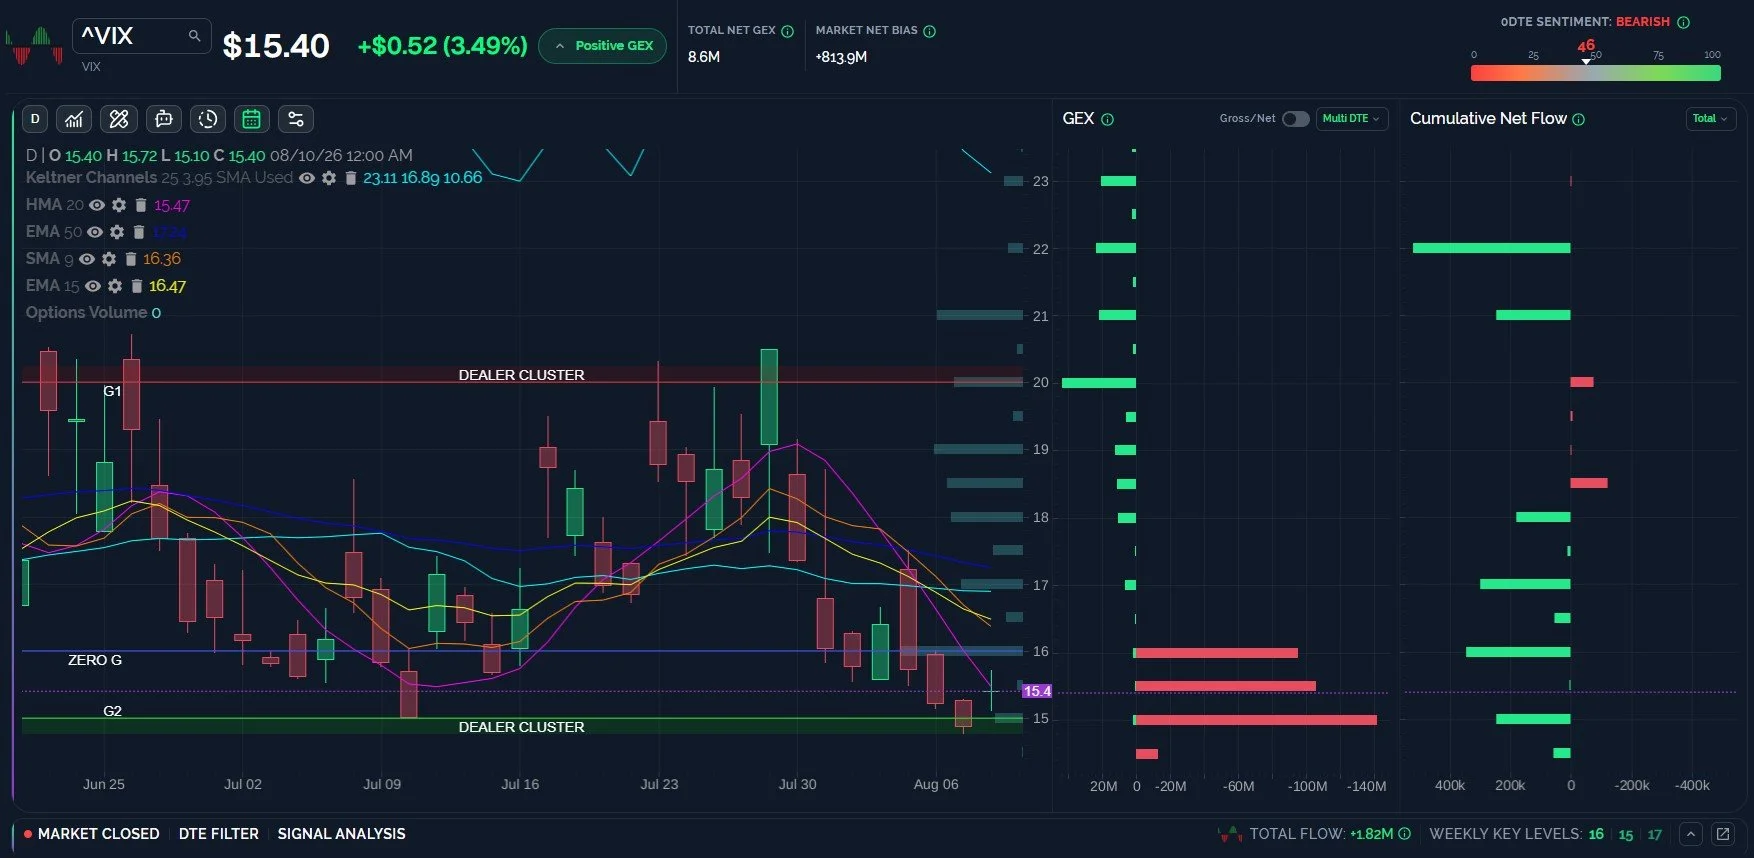
The VIX Is About To Cross The HMA, Indecision Candle Might Indicate Change
The VIX just might be getting buried enough to support the notion of at least a small bounce for volatility, perhaps accompanying a test of 7700 by SPX and 710 by QQQ. We see the declining HMA about to cross over the VIX, which would then bring VIX above the HMA, and we don’t see an increase in negative GEX for the VIX below 15. So 15 looks like a potential floor, for now. We see negative GEX up to 16, then positive GEX targeting 20, potentially higher, depending on the overall picture at that point. Moving averages on my chart bring 16.5 into focus as well, so I will use 16.5 as a more conservative measurement of whether or not the VIX is building the momentum to reach 20.
Key Levels: Volatility looks bullish above 16.5 targeting 20, bearish below 15 targeting zero (just kidding, but limited downside below 15).
Join The Discussion
We hope you will join us in Discord this week, where we will share some observations for free. Non-subscribers can join through Community on our homepage. First-time guests get a free 7-day trial of the premium Discord channels, where we talk through what is happening in real time.
Check out our YouTube video tonight if you have a few minutes! We talk about what we’re seeing with SPX, the VIX, QQQ, SMH, AMAT, NFLX, and more. You can watch the new video by clicking Community at the top of our homepage to find our YouTube channel link.
Join our livestream by clicking the link on our homepage every day around 10:30am ET, and you can replay the most recent one any time before the next one begins. We also post this link in Discord when we’re ready to start.
We now have a live demo on our homepage for those who want to explore the main sections of our website, so we invite non-members to check it out! We hope you’ll join us as members.
Thanks for being part of our community and know that we invite and appreciate your feedback!
The information provided by Geeks of Finance LLC is for educational purposes only and is not intended to be, nor should be construed as, an offer, recommendation or solicitation to buy or sell any security or instrument or to participate in any transaction or activity. Please view our Investment Adviser Disclaimer and Risk Disclosure.
