
GEX Looks Bullish For SPX, But VIX May Be Bottoming
SPX and QQQ didn’t close on Friday far from the highs of the week, painting a potentially bullish-looking picture heading toward the middle of August. The sideways consolidation is forcing the moving averages higher, closing the large gap between those averages and price, and GEX indicates SPX could reach 7900 by OpEx on the 21st. The VIX is within a zone that has seen reversals all year long, and GEX is approaching a contrarian extreme on SPX, so we may still see a pullback for SPX and QQQ before continuation higher.
Members save $300 on the annual Portfolio Manager plan with code SUMMER26 at checkout, which will run a few more days.
We also have a new offering for longer-term investors- appropriately named The Investor, featuring valuation analysis, customizable valuation model inputs, and A.I-assisted earnings report data and a lot more, and at a much lower price point than our competitors! Check it out on our homepage (link toward the end of the newsletter).
SPX May Target 7900 If It Can Hold Above 7800
Looking at SPX GEX between Monday’s expiration and OpEx Friday: We see the largest net negative GEX cluster at 7500, while the largest net positive GEX is at 7800 (fairly obvious even though I chose gross GEX on the chart below). We also see the large net negative GEX at 8000, secondary in NET size to the net GEX at 7500, and most of the net GEX clustered between 7700-7900. To conclude what this tells us at the moment, the picture is positive, with 7900 being possible above 7800, and 7500 becoming more realistic if we can see a daily close below 7700. The daily upper Keltner channel is currently at 7876 and declining, and I view that indicator as another potentially important level to watch.
Key Levels: Bullish above 7800 targeting 7900, possibly 8000. Bearish below 7700 targeting the “wall” at 7600, then 7500.
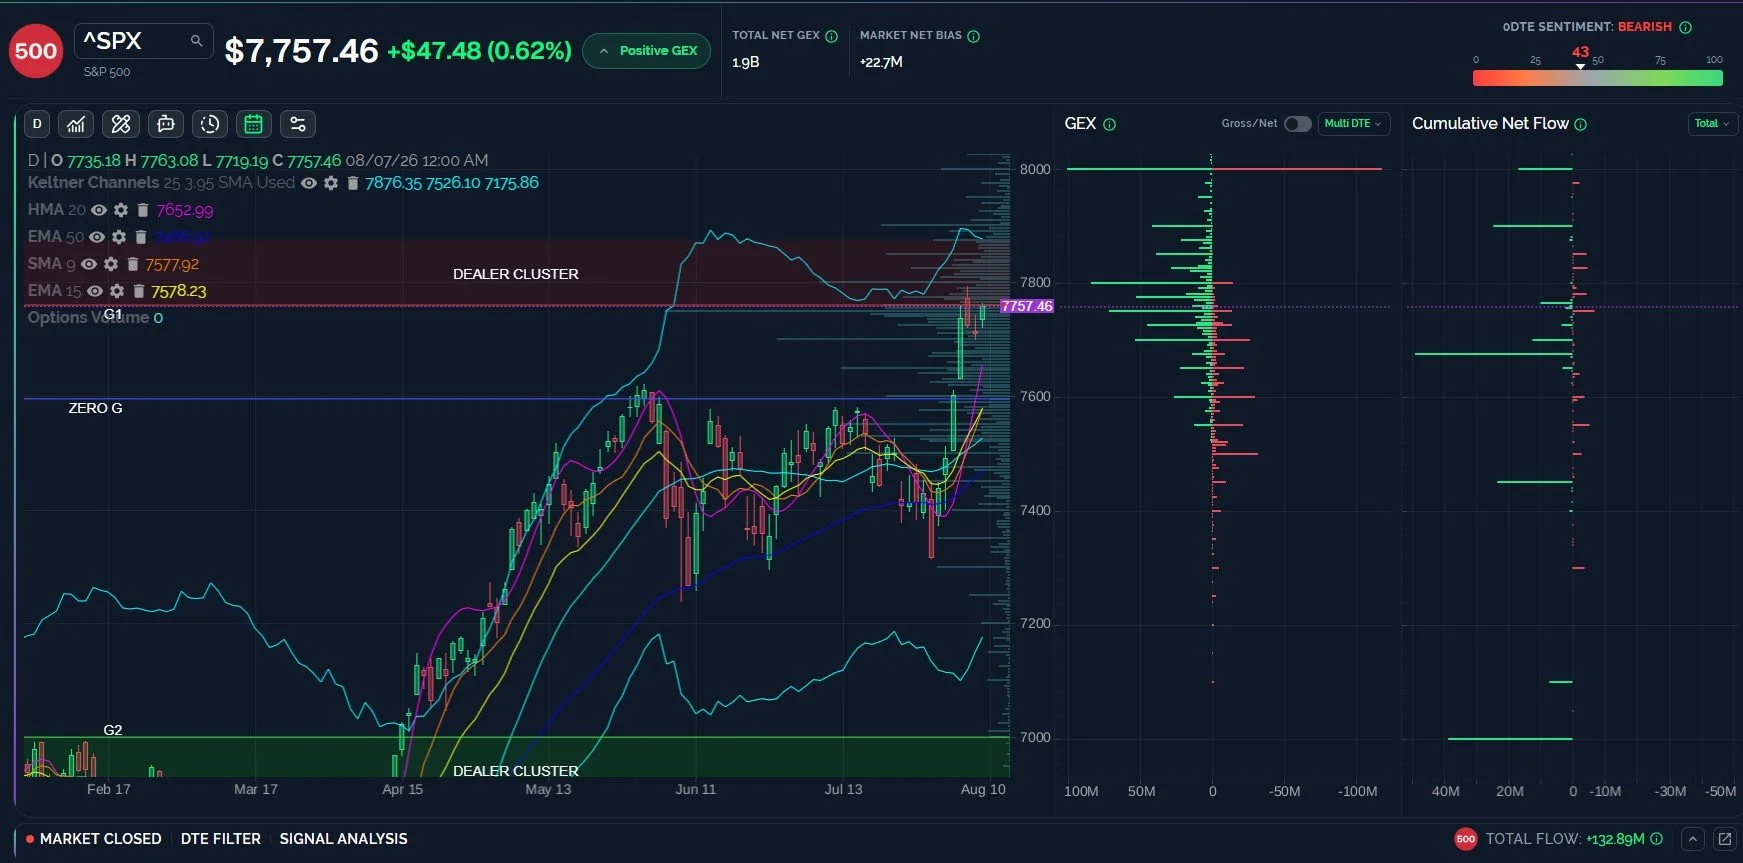
SPX Net GEX Is Bullish Compared To Prior Readings- But Nearing An Extreme
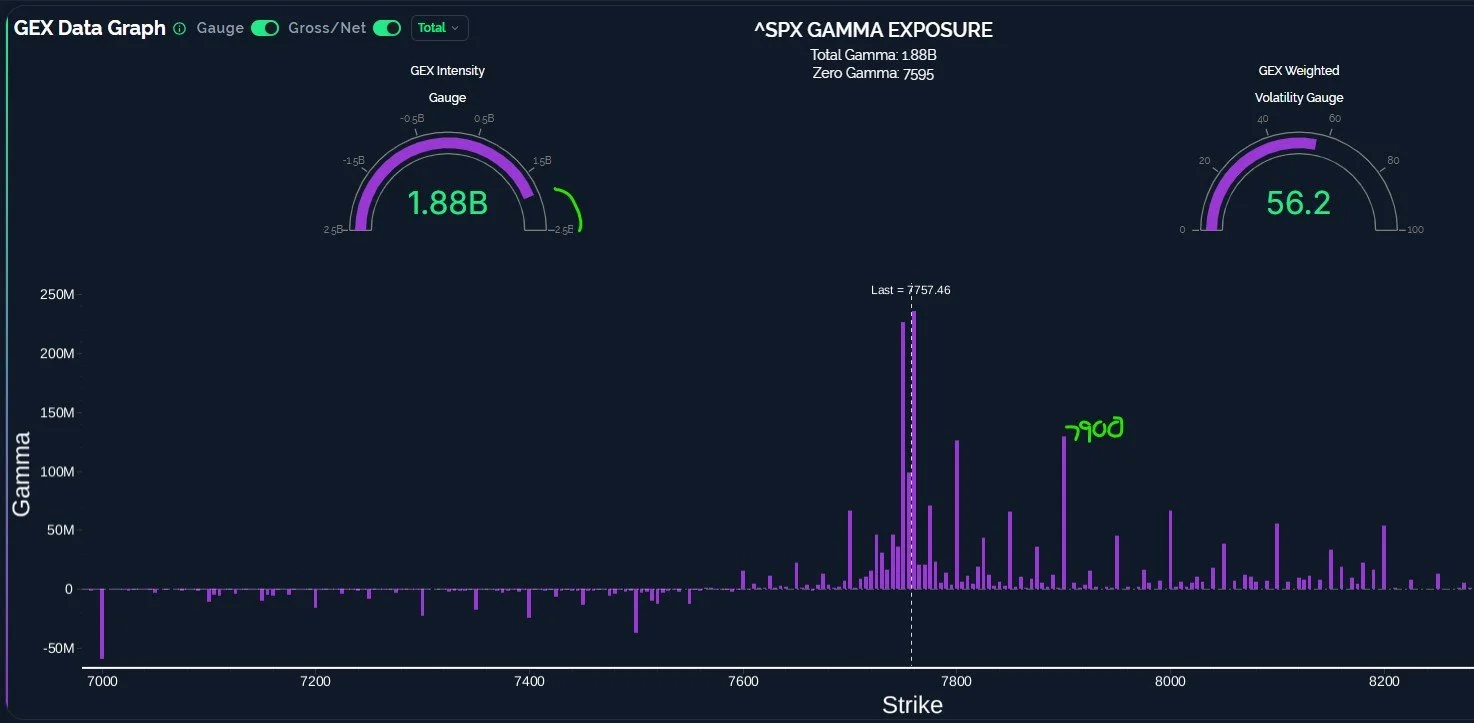
Our data graph below shows the total GEX picture (including last Friday, not restricted to the current OpEx cycle) and you’ll notice some differences in the net GEX picture: continued significant GEX at 7000, positive instead of net negative GEX at 8000, and net positive GEX all the way up to 8200. My own conclusion from this picture is that the next two weeks look a little more uncertain than the total picture that includes expirations beyond August 21. Perhaps we see some weakness in the next couple of weeks that resolves higher? That’s one interpretation. I also notice the GEX Intensity Gauge at 1.88B, which is nearing the 2.5B level we consider extreme when compared to prior readings over the last 52 weeks, yet there’s a little room to go to reach that 2.5B. We may be nearing a point where a short-term pullback may be more likely, but we’ll monitor the situation as the cash session unfolds Monday.
QQQ May Ultimately Target 740-745 Into OpEx
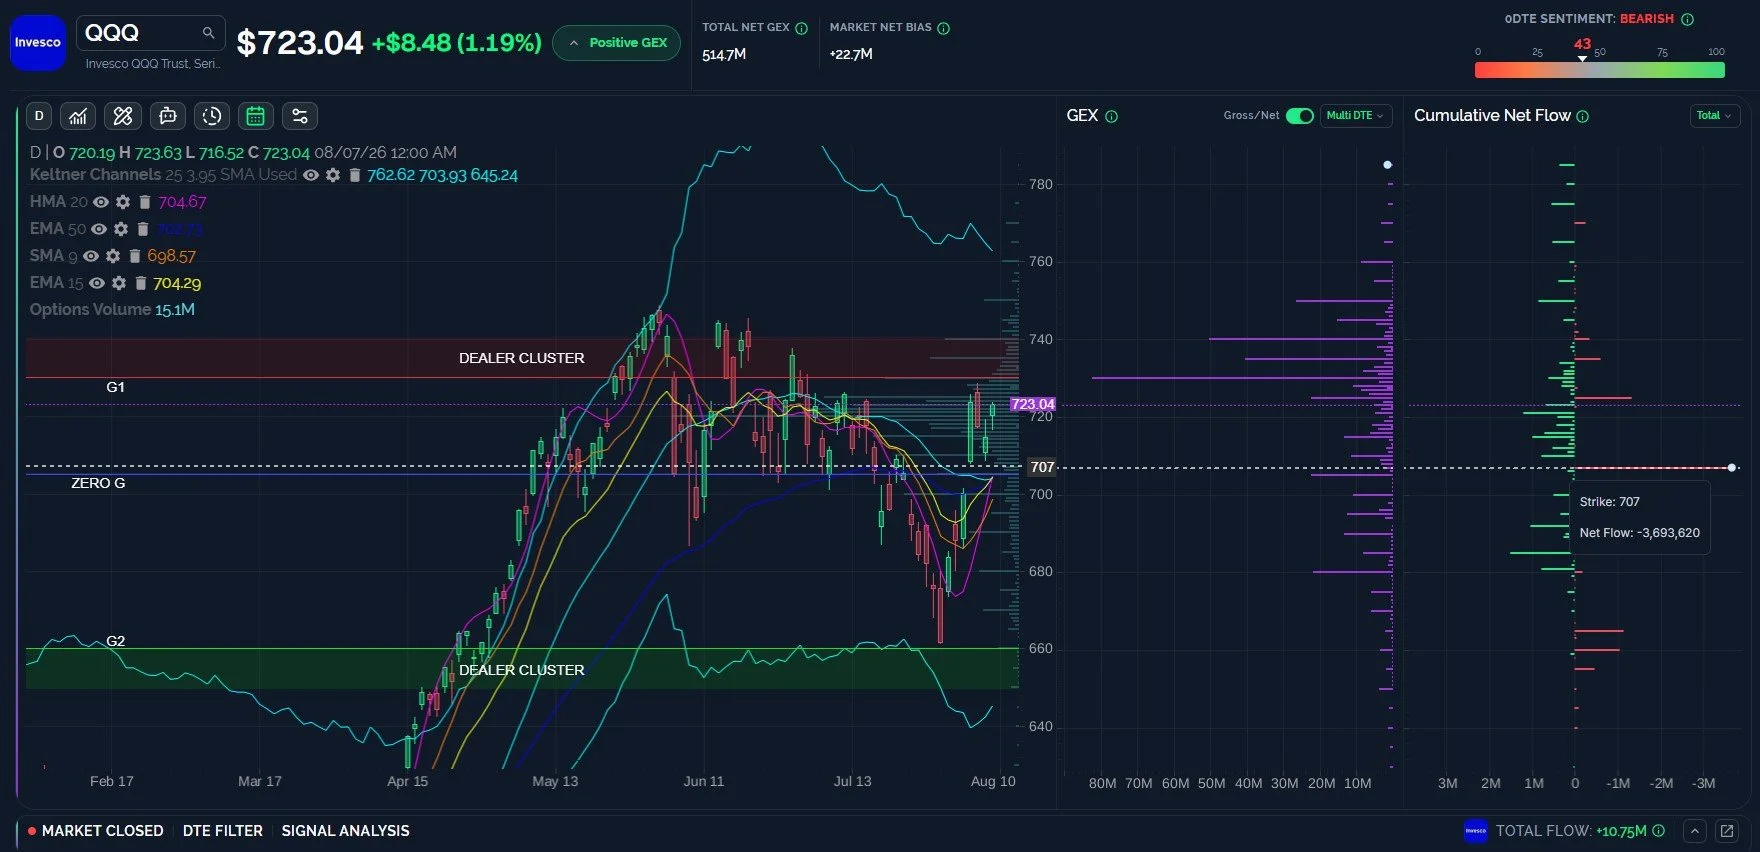
QQQ net GEX for the remaining time through OpEx Friday is skewed positive toward 740-745. With the HMA rising rapidly and currently near 705, any drop that holds that area suggests further upside is likely. Interestingly, the largest net negative option flow on Friday was at 707.
Key Levels: Bullish above 730 targeting 740-745 Bearish below 720 targeting 707. Below 700 targets 680.
The VIX And VVIX Diverge, VIX Has Setup For At Least A Small SPike
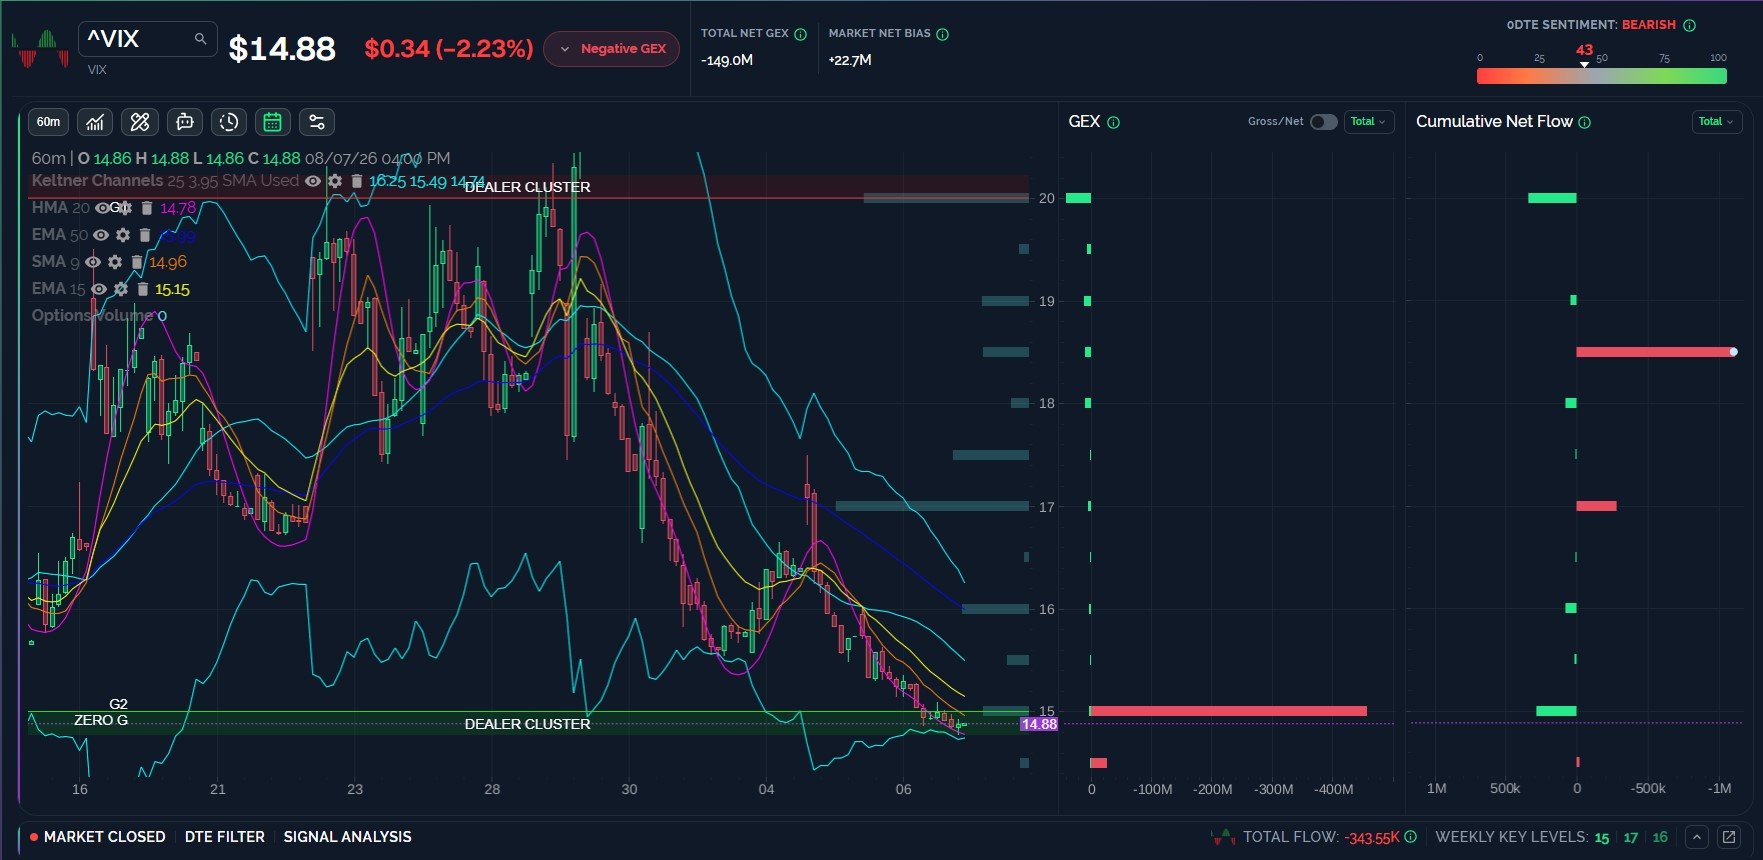
The VIX continues to hold above the HMA on the 1-hour chart, just above the lower Keltner channel. We also see VVIX positive as of Friday’s close while the VIX was lower, a divergence that statistically matters when we see 3+ such divergences over a 1-2 week period, predicting a potential VIX spike of some magnitude. The 14-15 area has been a bottoming zone all year, so the burden is on the bulls to demonstrate a “new normal” where the VIX is destined to stay below 15. I have my doubts, to say the least.
Key Levels: Volatility looks bullish above 15 targeting 17, then 20. Bearish below 15 targeting 14.
Join The Discussion
We hope you will join us in Discord this week, where we will share some observations for free. Non-subscribers can join through Community on our homepage. First-time guests get a free 7-day trial of the premium Discord channels, where we talk through what is happening in real time.
Check out our YouTube video tonight if you have a few minutes! We talk about what we’re seeing with SPX, the VIX, GLD, NOW, ADBE, AMD, MU, and more. You can watch the new video by clicking Community at the top of our homepage to find our YouTube channel link.
Join our livestream by clicking the link on our homepage every day around 10:30am ET, and you can replay the most recent one any time before the next one begins. We also post this link in Discord when we’re ready to start.
We now have a live demo on our homepage for those who want to explore the main sections of our website, so we invite non-members to check it out! We hope you’ll join us as members.
Thanks for being part of our community and know that we invite and appreciate your feedback!
The information provided by Geeks of Finance LLC is for educational purposes only and is not intended to be, nor should be construed as, an offer, recommendation or solicitation to buy or sell any security or instrument or to participate in any transaction or activity. Please view our Investment Adviser Disclaimer and Risk Disclosure.
