
Indices Unclear, VIX Nearing A Turn?
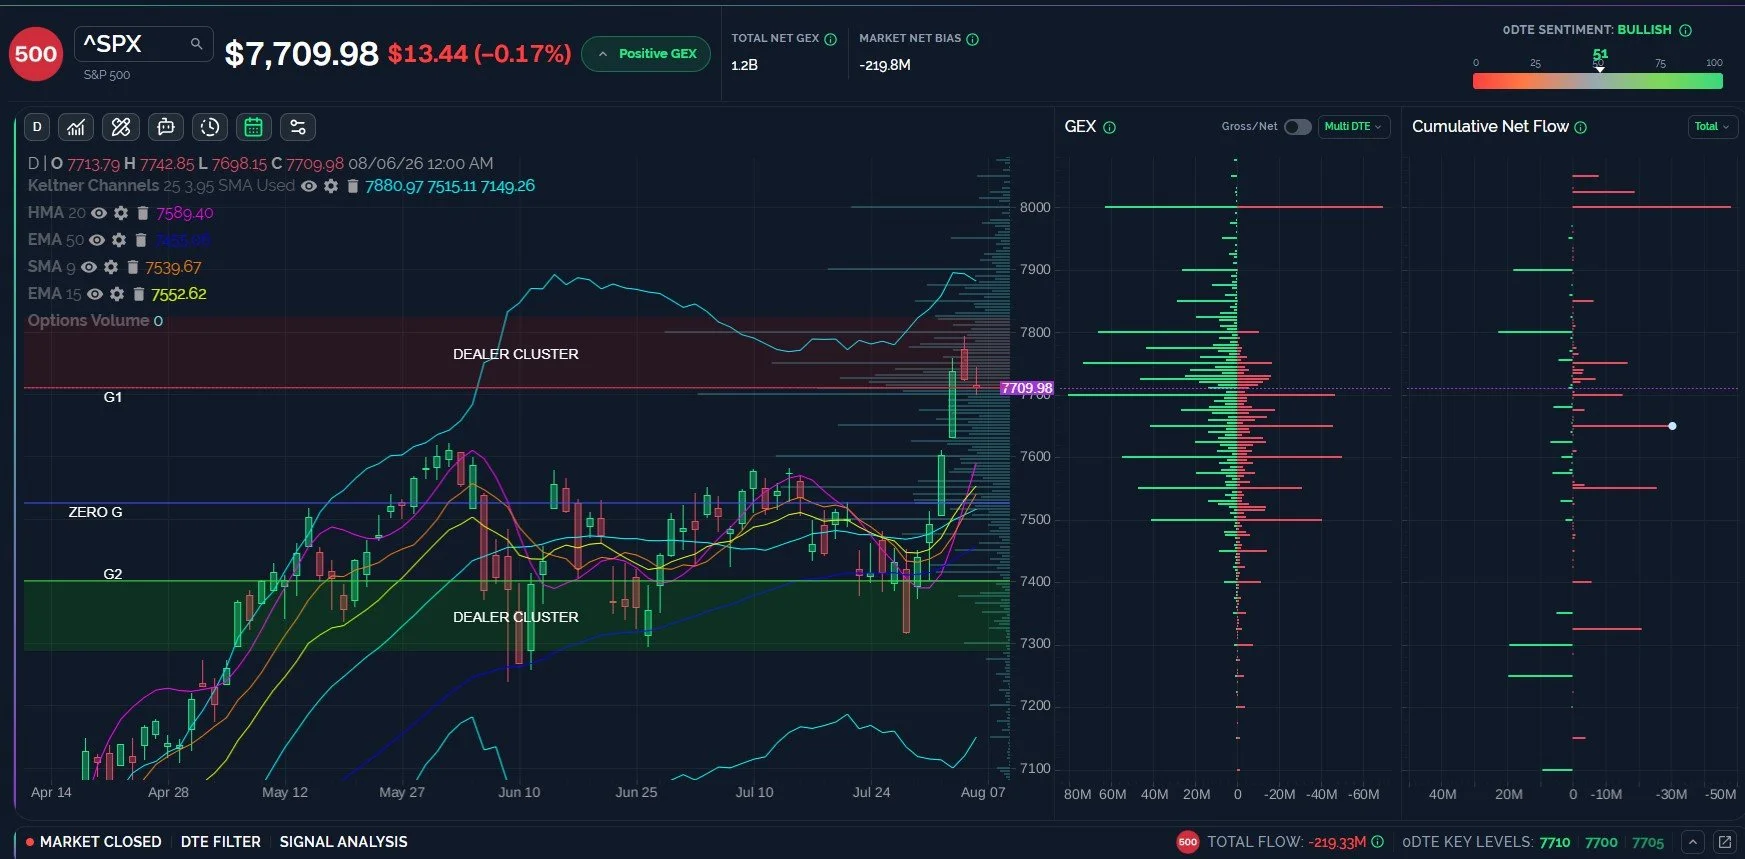
In yesterday’s newsletter, we wrote that the VIX looked like it was due for a bounce within hours of last night, and that it looked “bullish above 16., targeting 17-20.” I think we found the correct pivot, since the VIX topped just above 16 before getting smashed down to a low of 15.11. SPX was more stubborn than QQQ, refusing to lose the all-important 7700 level (so-called due to the huge GEX at 7700), but QQQ closed below the GEX at 715 after closing below the important 720 level yesterday. Not a good look. Alas, the market is always full of surprises, so let’s look at levels in both directions we’re watching for Friday and next week.
Members save $300 on the annual Portfolio Manager plan with code SUMMER26 at checkout, which will run a few more days.
We also have a new offering for longer-term investors- appropriately named The Investor, featuring valuation analysis, customizable valuation model inputs, and A.I-assisted earnings report data and a lot more, and at a much lower price point than our competitors! Check it out on our homepage (link toward the end of the newsletter).
SPX Net GEX Picture Looks Terrifying For Bears
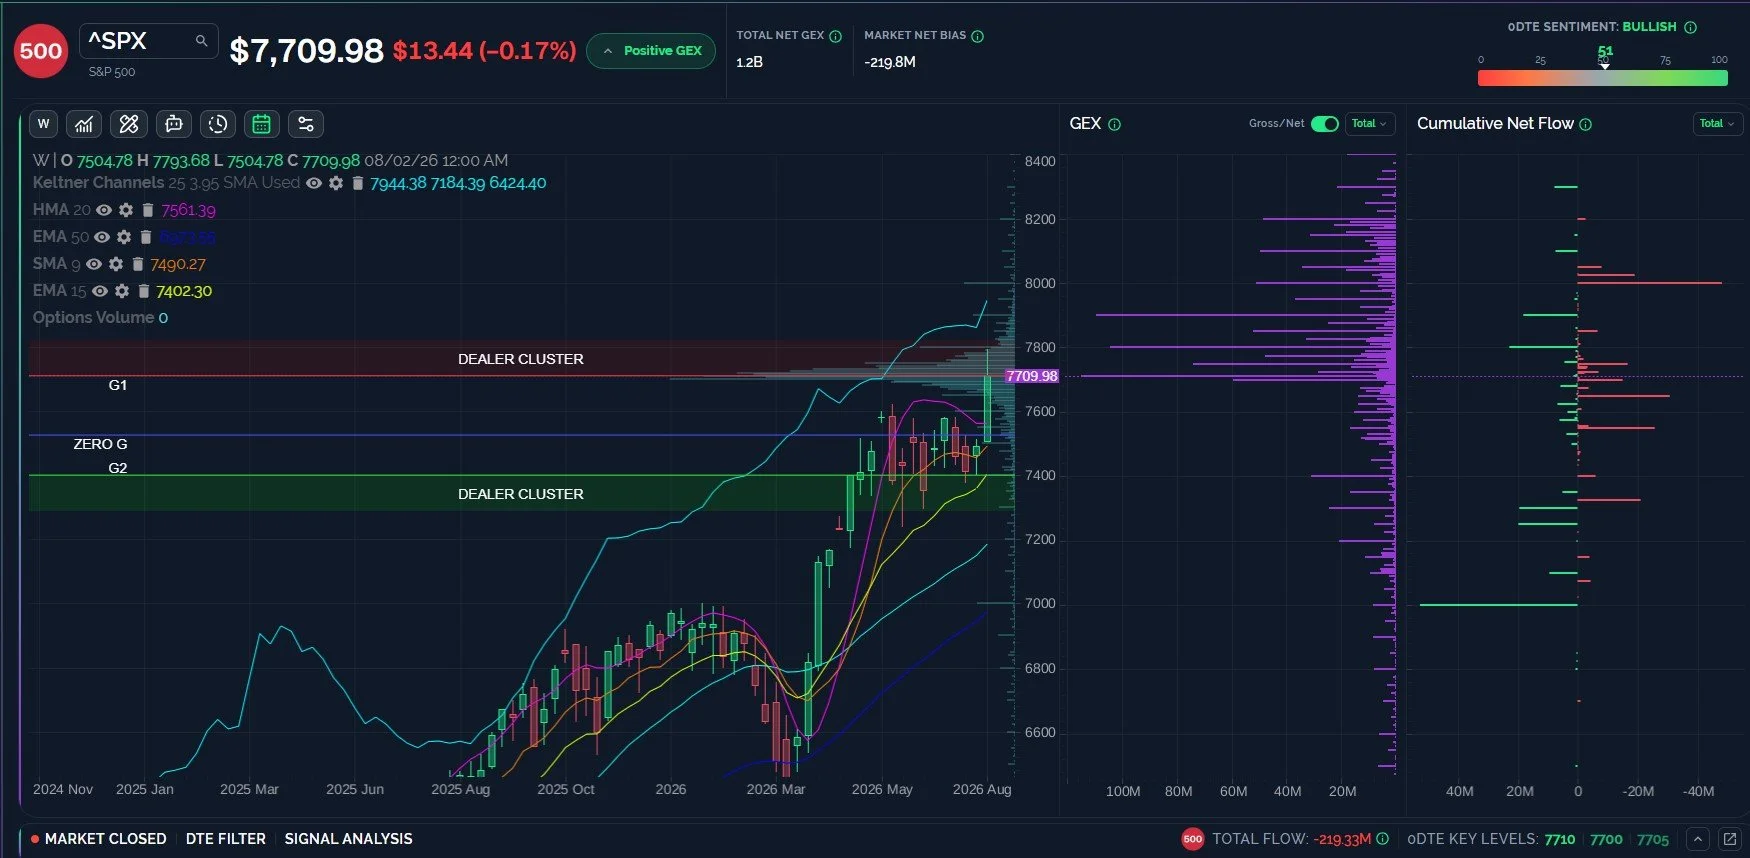
If I’m a bear looking at the weekly chart and total GEX picture below, I’m probably looking for the nearest circus to join as a performer, just to avoid the hunting party approaching my section of the woods. Give me a hat and a unicycle and I’ll peddle for days. SPX net GEX is positive, with growing net GEX up to 8200, and the Keltner channels (along with several moving averages) are steadily climbing upward and to the right. The latest move higher does raise questions: Should we see meaningful mean reversion given the big move off of a declining HMA? Does the negative option flow (referencing the cumulative net flow on the chart) for the day mean we’re set for a deeper drop soon? Let’s look at gross GEX showing positive and negative GEX for a different perspective on the next chart.
SPX Gross GEX Picture Looks More Challenging
We view net GEX clusters as magnets for price movement in general (considering the overall net GEX bias and other factors), while viewing gross GEX as indications of areas that may be support/resistance areas, but it’s hard to ignore the activity at the 8000 strike and its significance. The gross GEX picture also shows the most significant range of GEX (from now until OpEx Aug 21) to be between 7500-7800, with “honorable mention” of the net GEX at 7900. We conclude that 8000 doesn’t really come into focus until SPX prints a daily close above 7800, and a close below 7700 could bring prices as low as 7500, though the HMA approaching 7600 may be a higher-odds initial target to watch for potential reversal to the upside again.
Key levels: Bullish above 7700 targeting 7800, then 8000. Bearish below 7700 targeting 7600, 7500.
QQQ 700 Continues To Be “The” Pivot
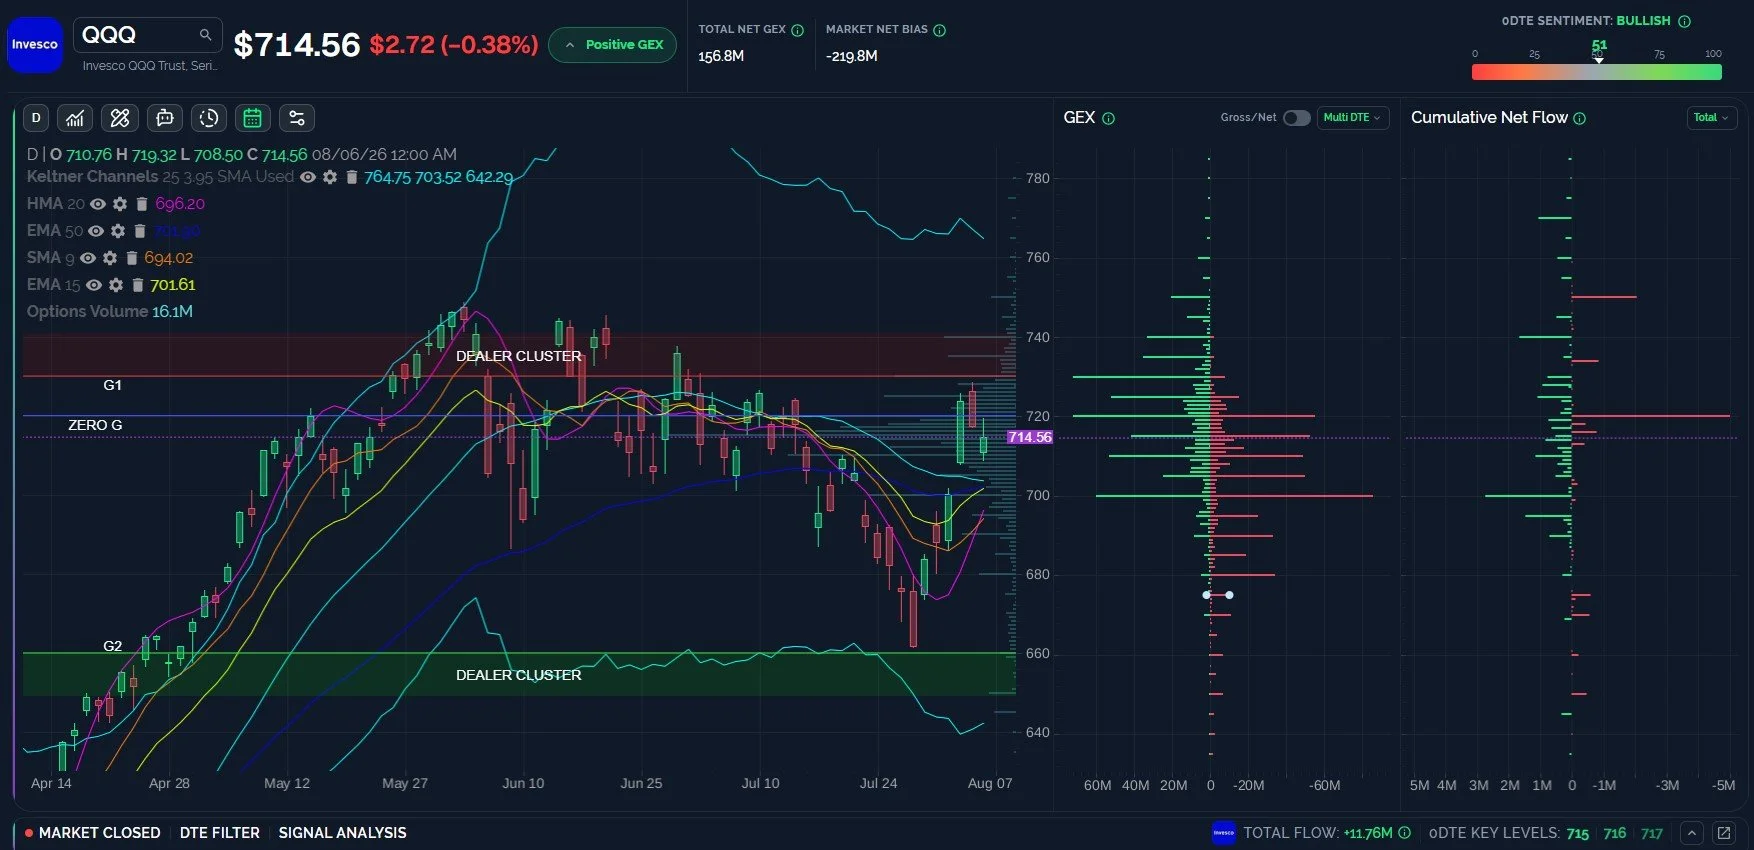
QQQ hasn’t made a new high yet, unlike SPX, but the breaking of the downtrend certainly looks positive. Net option flow has also been positive over the last two days. If we assume the recent rally was mostly a case of “too far, too fast,” we’d like to see QQQ hold a retest of 700 (fill that gap!) and then continue on to new highs. 720 was a more relevant short-term pivot when we were higher than 720 a couple of days ago, and we’re still below 720. If QQQ can retake 720, 730-740 may be an initial upside target, but that range wouldn’t set a new high, so we need to watch the 740 area and if QQQ can print a daily close above 740. Below 700 and we’re likely retesting 680, then 660, potentially resulting in a more prolonged consolidation sideways/down.
Key Levels: Bullish above 720 targeting 730-740. Bearish below 700 targeting 660. Chop in between.
The VIX Percentage Bollinger Indicator Nears A Possible Turn
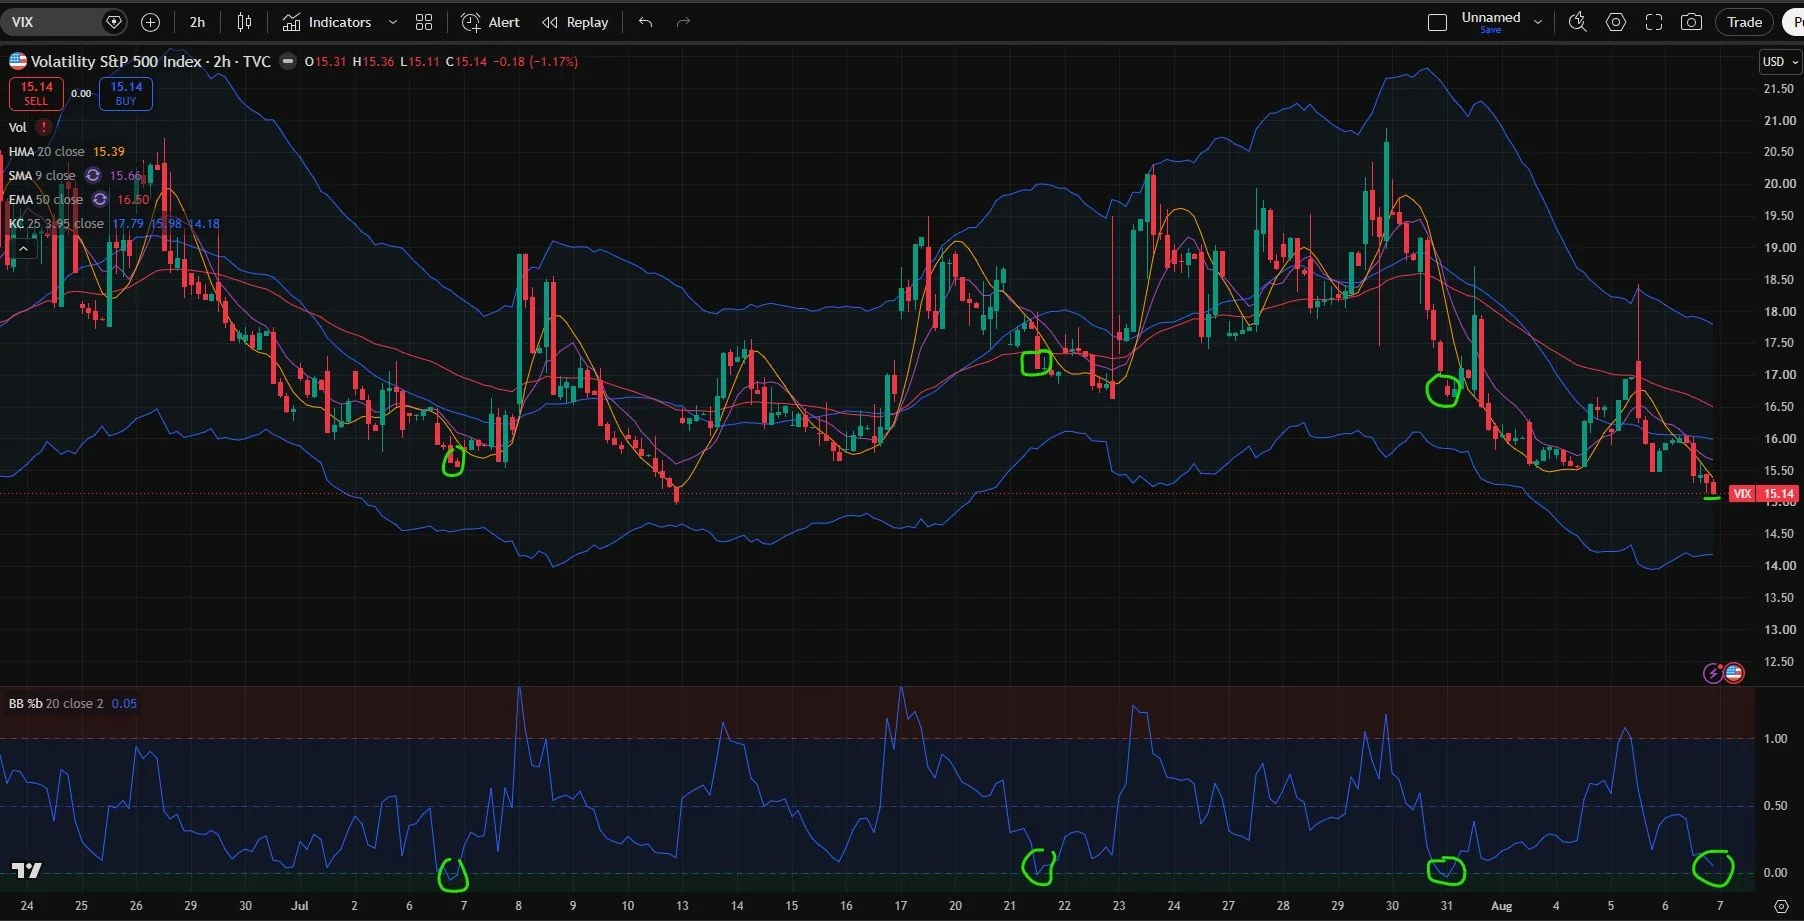
We got our 30-minute chart bounce Thursday morning, but the VIX couldn’t even hold 16. The 2-hour and 4-hour charts never showed buy signals. We’re now approaching a higher conviction and more extreme reading on the 2-hour chart as the %b indicator approaches zero again. I’ve circled the last several instances where the VIX actually touched 0.00 (imperfect and incomplete circles drawn to ensure you know the analysis was done by O.I.-Organic Intelligence- instead of A.I) so you can see the effectiveness of that reading marking short-term bottoms for the VIX. Not always the exact 2-hour bar where the VIX touches the oversold reading, but typically within a few bars…So the VIX may be close to a reversal targeting 18.
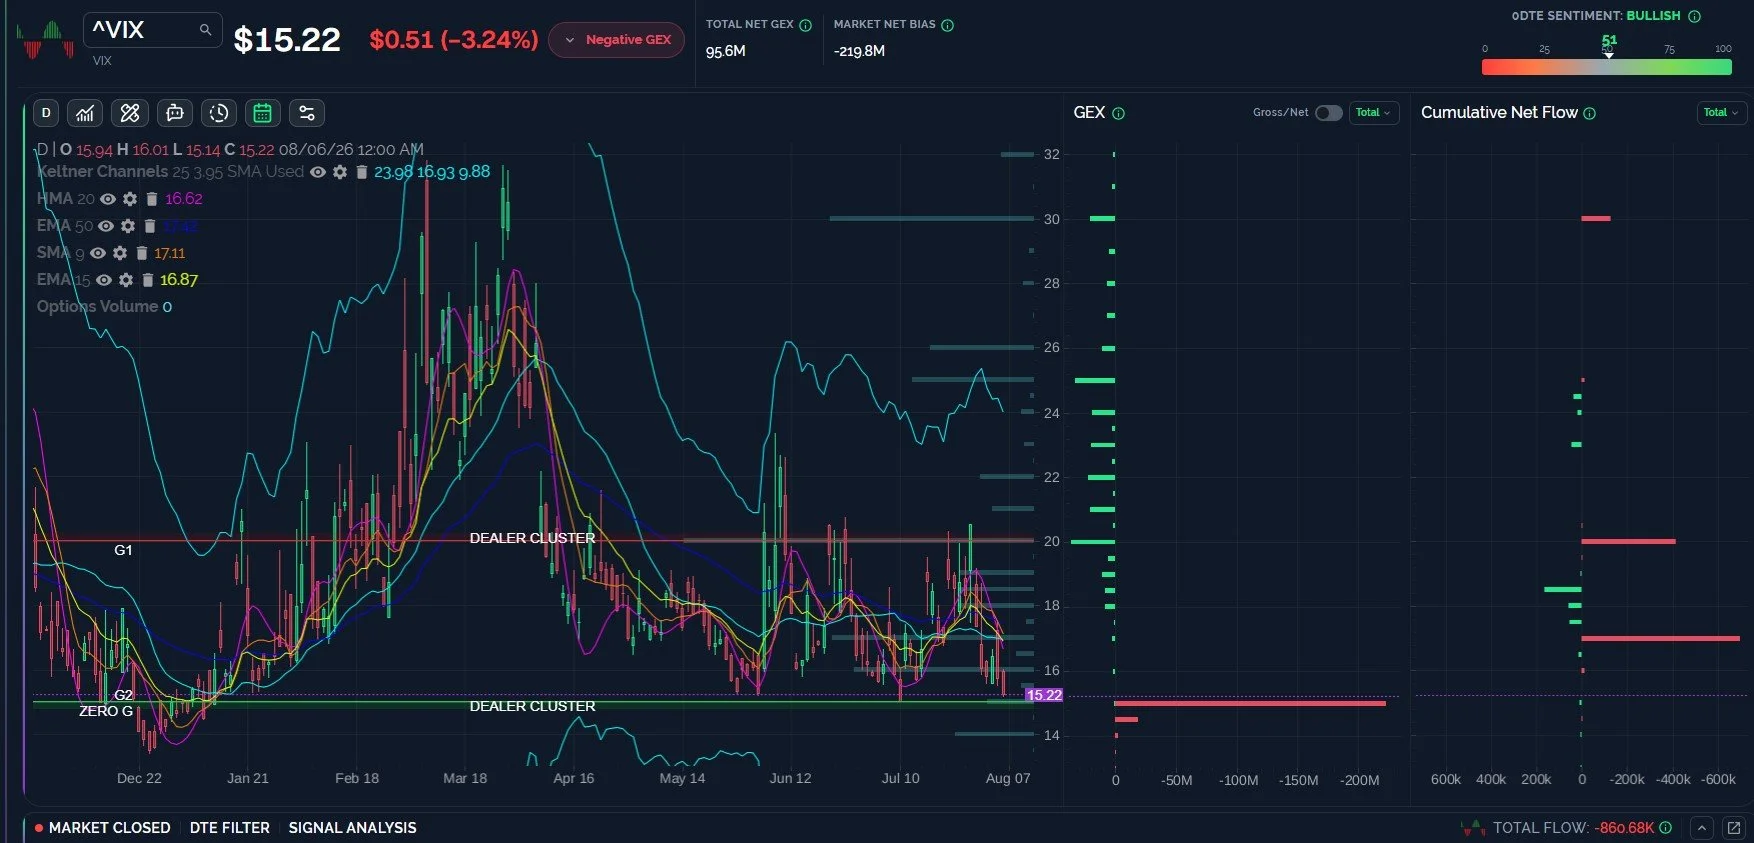
Any VIX Bounce May Reach 17, But Can We See Higher VIX Destinations?
The daily chart shows a thick confluence of moving averages between 16.80-17, and some large negative flow activity at 17, so it’s possible the next VIX spike is 10% or so with failure to breach 17. We still view downside as limited, and holding above 17 intraday or at the close could imply at least a brief spike higher than 17, so we’ll watch closely if that boundary is violated.
Bullish above 16 targeting 17-20. Bearish below 15 targeting “pennies in front of a steamroller” downside to 14.
Join The Discussion
We hope you will join us in Discord this week, where we will share some observations for free. Non-subscribers can join through Community on our homepage. First-time guests get a free 7-day trial of the premium Discord channels, where we talk through what is happening in real time.
Check out our YouTube video tonight if you have a few minutes! We talk about what we’re seeing for tomorrow as well as coverage of some individual stocks like MU. You can watch the new video by clicking Community at the top of our homepage to find our YouTube channel link.
Join our livestream by clicking the link on our homepage every day around 10:30am ET, and you can replay the most recent one any time before the next one begins.
We now have a live demo on our homepage for those who want to explore the main sections of our website, so we invite non-members to check it out! We hope you’ll join us as members.
Thanks for being part of our community and know that we invite and appreciate your feedback!
The information provided by Geeks of Finance LLC is for educational purposes only and is not intended to be, nor should be construed as, an offer, recommendation or solicitation to buy or sell any security or instrument or to participate in any transaction or activity. Please view our Investment Adviser Disclaimer and Risk Disclosure.
