
VIX Divergences Building As Near-term Upside Appears Limited
NVDA was essentially the entire market today, allowing major indices to print green candles despite all other sectors appearing solidly red. While we didn’t address potential correlations between sectors over the past several days, we did address NVDA’s positive GEX at 230 and 240, with today’s high just above the 230 mark. NVDA has a shaky record of immediate continuation higher after earnings lately, and my base expectation is for some amount of consolidation before sustaining higher prices. The VIX presents some interesting divergences that point to a short-term rebound and SPX appears to have limited near-term upside.
Members save $300 on the annual Portfolio Manager plan with code SUMMER26 at checkout, which is nearing its end over the next few days.
We also have a new offering for longer-term investors- appropriately named The Investor, featuring valuation analysis, customizable valuation model inputs, and A.I-assisted earnings report data and a lot more, and at a much lower price point than our competitors! Check it out under Pricing, or click Stocks on our homepage demo (link toward the end of the newsletter).
VIX positive GEX Steadily Rises, VIX Declines
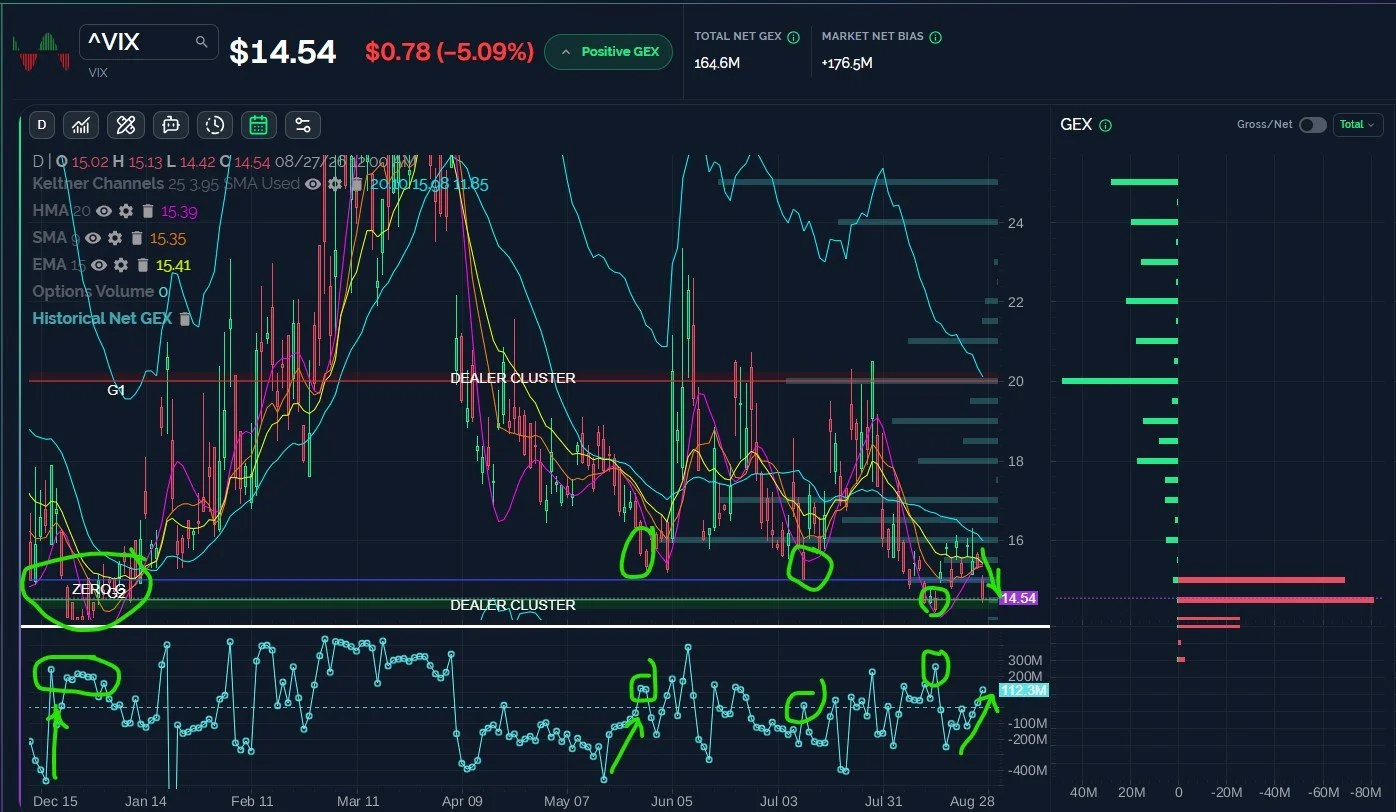
There may be more than meets the eye with today’s apparent VIX collapse. Today’s drop brought the VIX to the lower Keltner channel on the 1 and 2 hour timeframes, and the %b (20,2) indicator is at 0.00, one of our favorite bottoming indicators, at least within several bars. Furthermore, while the VIX sometimes makes net GEX highs as the VIX spikes, I’ve circled just a few instances of the VIX dropping into a low as VIX net GEX spikes, which appears to be a good bottom signal in the instances I’ve highlighted recently. The VIX is at that point now.
Key Levels: Bullish above 15.5 targeting 18, then 20. Bearish below 14.5 targeting 14.
SPX Has a Pathway to 7800, 1-Hour Chart Suggests 7750 May be Challenging
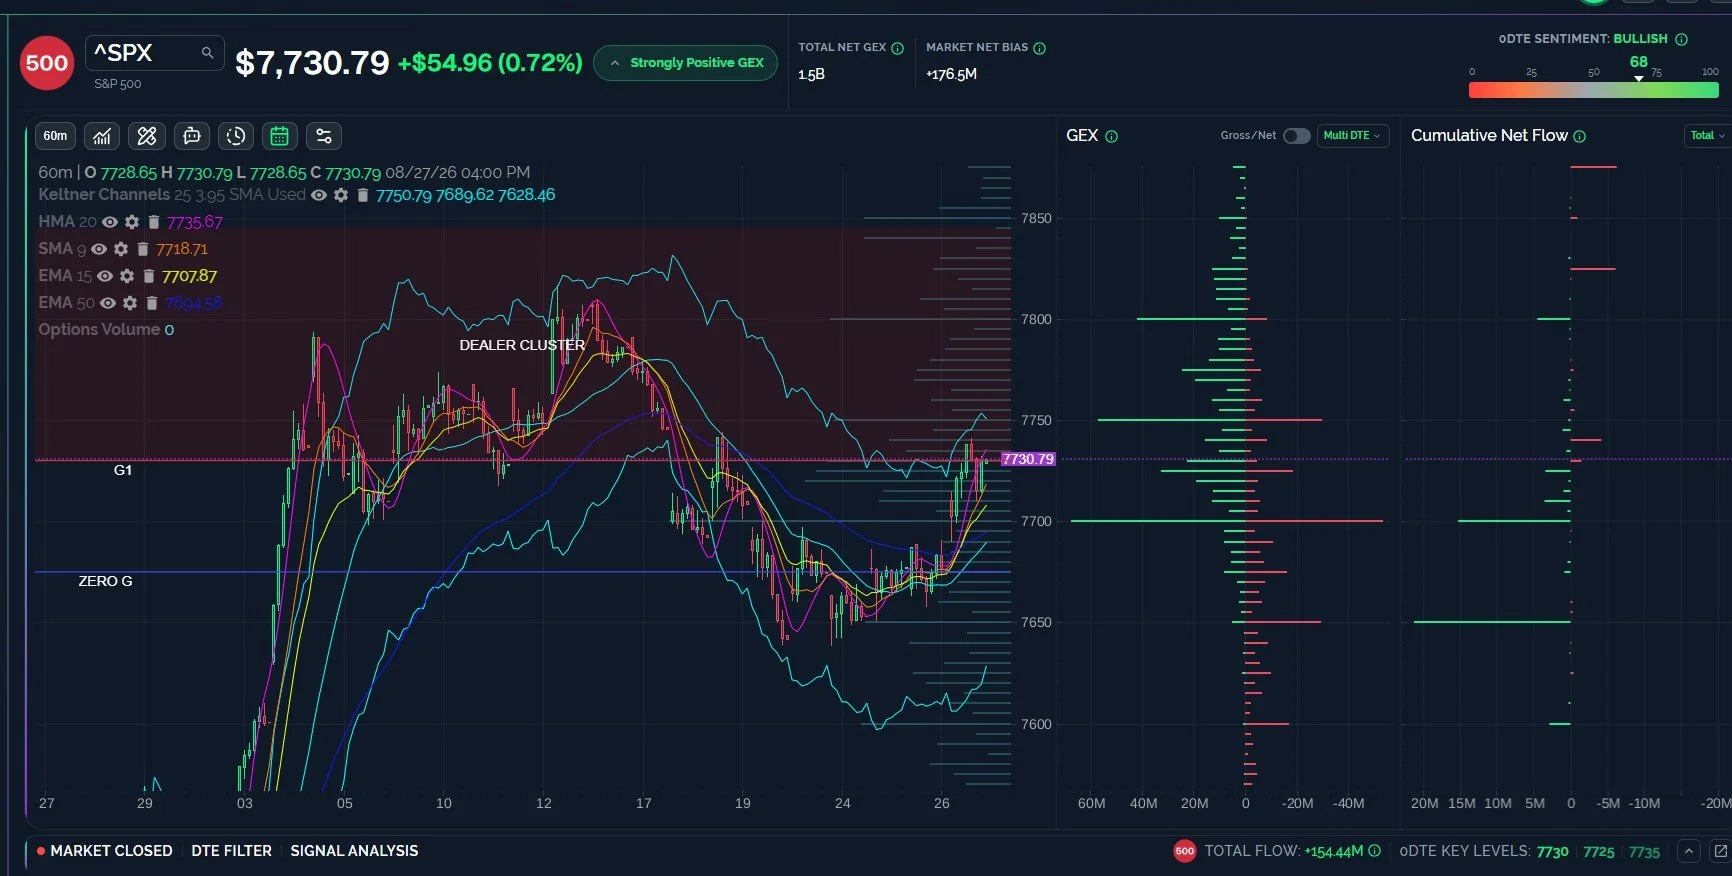
Net GEX for Friday is actually fairly wide by normal standards, spanning 100 points from 7700-7800. The upper Keltner channel on the 1-hour chart currently aligns well with the GEX at 7750, and the HMA is rapidly approaching that upper channel, currently at 7736, so SPX appears to have a number of potential headwinds as we approach 7750. Only a move over 7750 will bring 7800 into clearer focus.
Key Levels: Bullish above 7750 targeting 7800. Bearish below 7725 targeting 7700, 7650.
QQQ Closed Above 720, But Upside May be Limited to 725-730
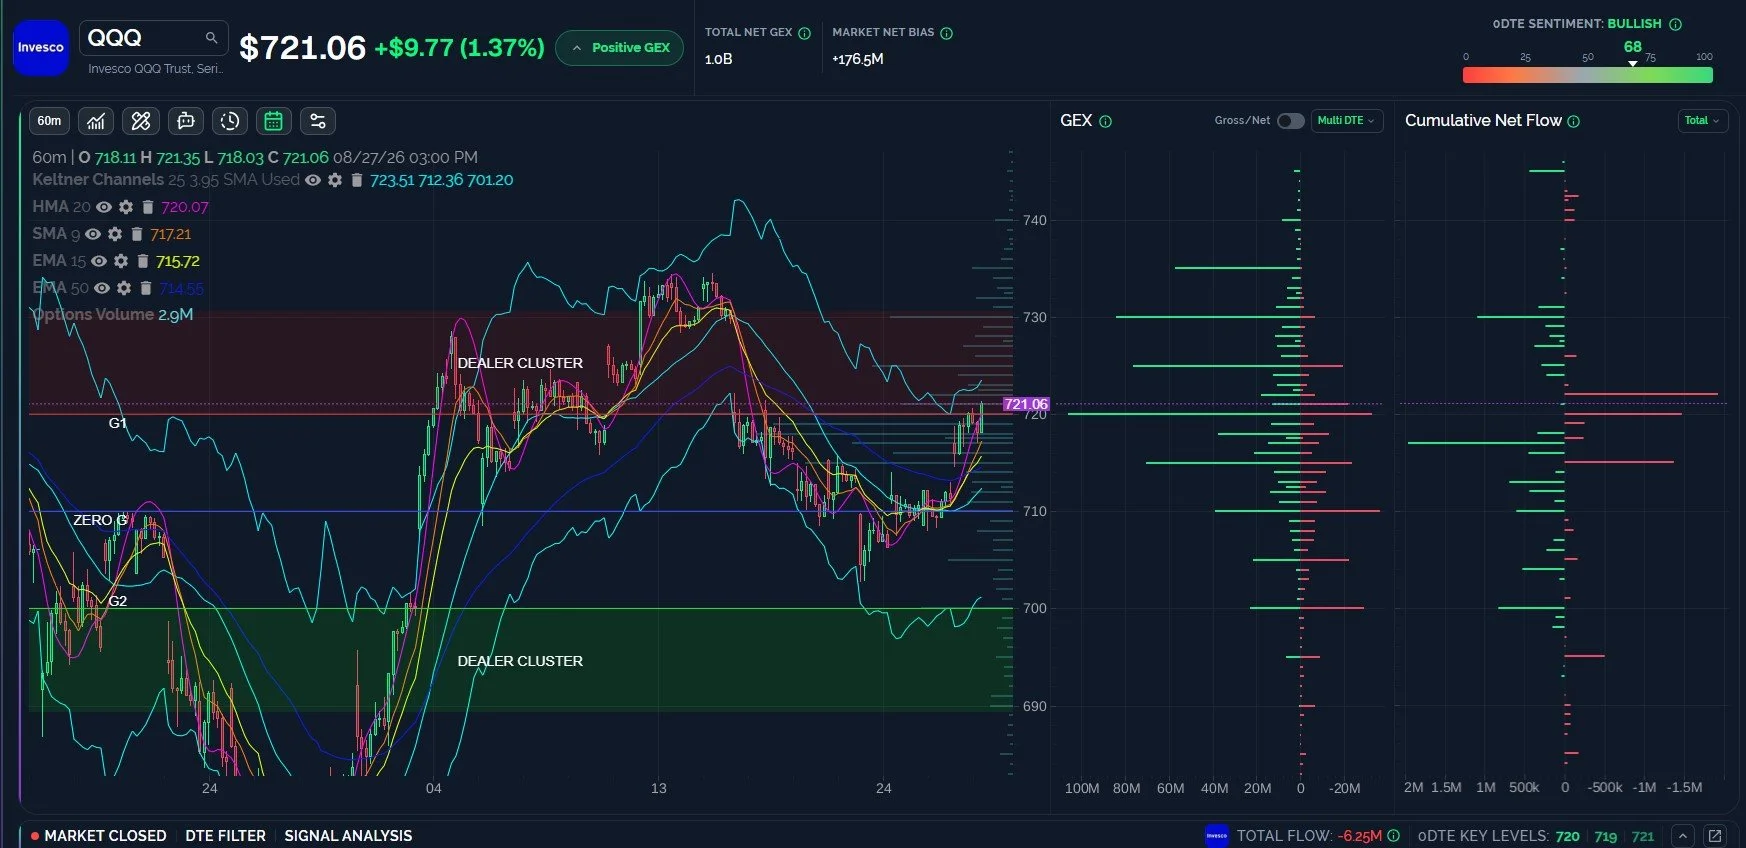
QQQ saw a lot of net negative option flow between 720 and 722, but the overall GEX picture looks bullish above 720, with 730-735 remaining the upside focus. The technical picture with the Keltner channels and the HMA looks challenging though, similar to SPX’s picture. A loss of 720 could easily see a GEX shift and/or a drop to 715 or lower.
Key Levels: Bullish above 720 targeting 730, 735. Bearish below 720 targeting 715, 710.
Negative GEX on IWM 295 Starting to Stick Out Like a Sore Thumb
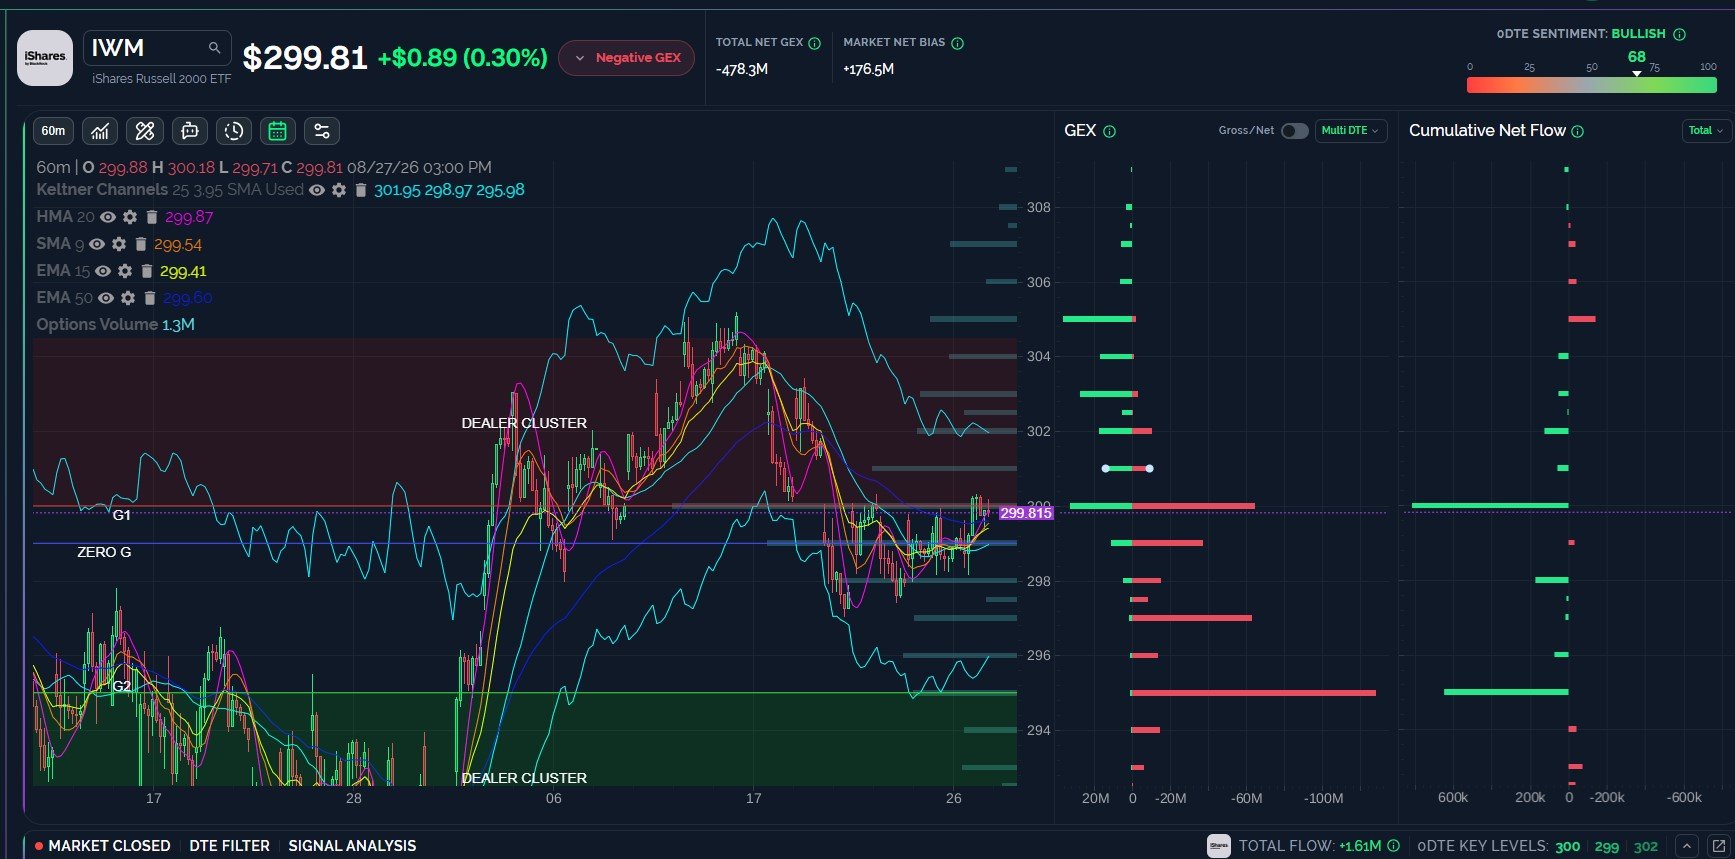
Negative GEX on IWM is prominent at 295 for tomorrow’s expiration, and technically, IWM did close below the HMA. IWM has looked bullish for quite some time now, and it still does, but the near-term GEX picture warrants some degree of caution. Positive GEX is visible up to 305 if IWM can overtake 300-302 on Friday.
Key Levels: Bullish above 300 targeting 305-310. Bearish below 297 targeting 295, then 290.
Join The Discussion
We hope you will join us in Discord this week, where we will share some observations for free. Non-subscribers can join through Community on our homepage. First-time guests get a free 7-day trial of the premium Discord channels, where we talk through what is happening in real time.
Our YouTube videos can be viewed by clicking Community at the top of our homepage to find the channel link.
Join our livestream by clicking the link on our homepage every day around 10:30am ET, and you can replay the most recent one any time before the next one begins. We also post this link in Discord when we’re ready to start.
We now have a live demo on our homepage for those who want to explore the main sections of our website, so we invite non-members to check it out!
Thanks for being part of our community and know that we invite and appreciate your feedback!
The information provided by Geeks of Finance LLC is for educational purposes only and is not intended to be, nor should be construed as, an offer, recommendation or solicitation to buy or sell any security or instrument or to participate in any transaction or activity. Please view our Investment Adviser Disclaimer and Risk Disclosure.
