
Immediate SPX Weakness Possible, Resolution to the Upside
In Thursday evening’s newsletter, we suggests NVDA consolidation and the possibility of a VIX spike before more upside in the broader indices. Friday saw a drop in NVDA while the VIX was flat, with the flat VIX on a Friday being the least surprising event to note. We appear to be seeing some signs of life from the VIX with Sunday’s futures open, so perhaps we’re a little closer to a reminder of what a two-way market feels like, if only for a moment. The GEX picture for the VIX suggests risk until September 9 while SPX suggests ultimate upside resolution for stocks.
Interested in joining our group? Save a rare $350 off of the annual Portfolio Manager plan with code LABORDAY26 at checkout!
VIX GEX Divergences Suggest Potential Market Weakness Through Sept. 9
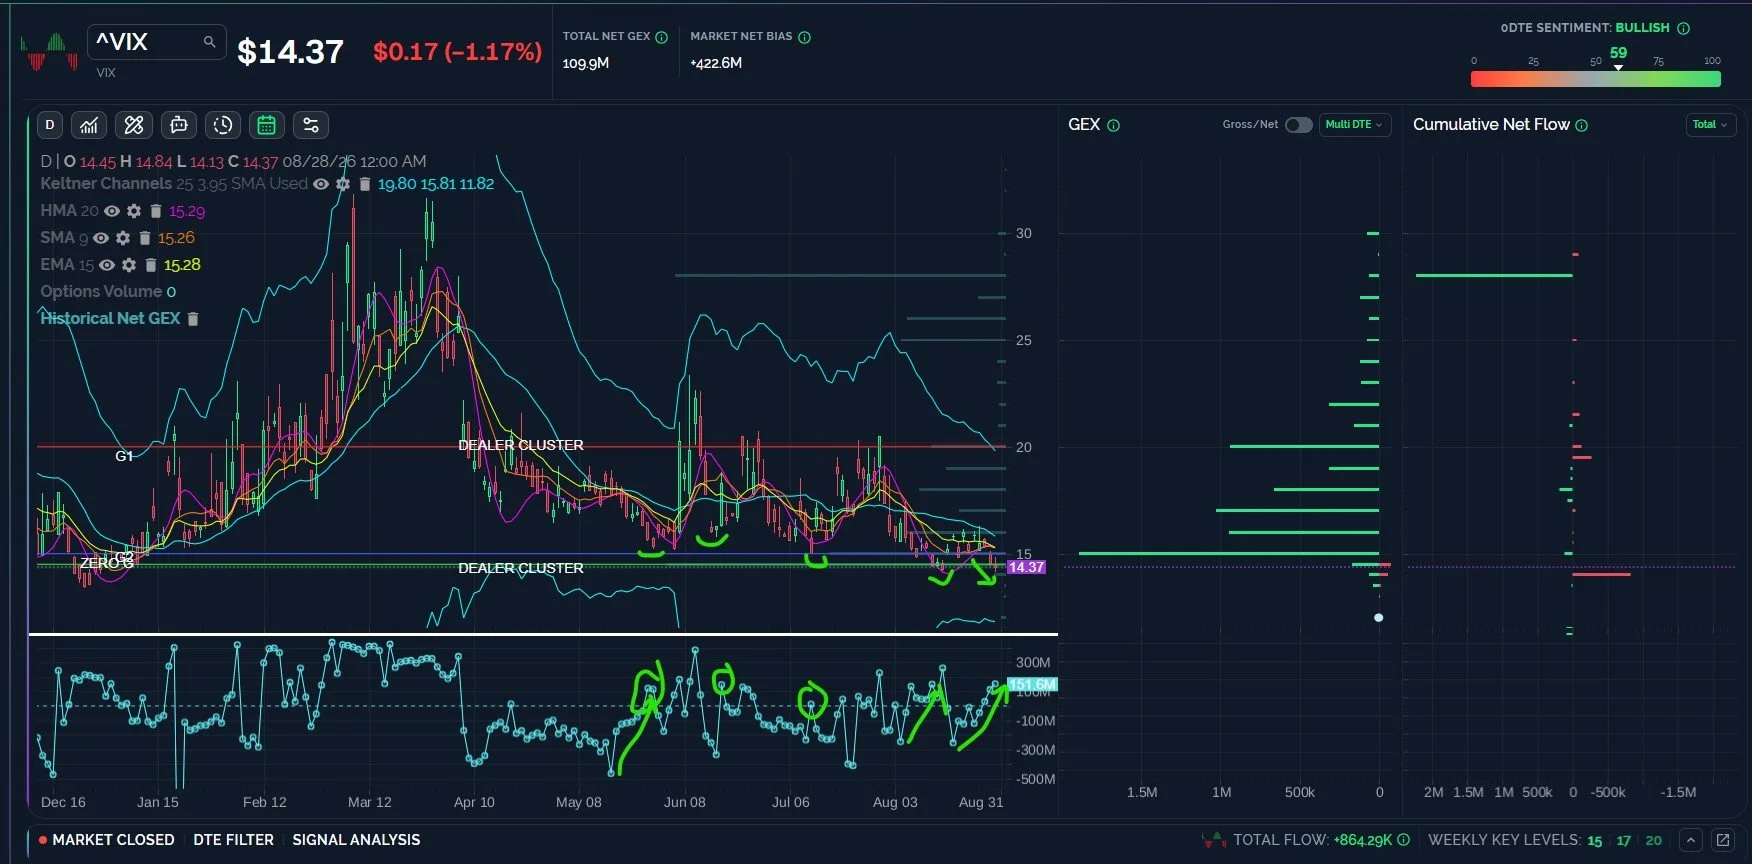
Last week we noted the week-long positive GEX divergence for the VIX, with GEX rising as the VIX declined. We pointed out that the VIX does see GEX rise during VIX spikes, but the more interesting signals are the VIX bottoms that have coincided with GEX spikes that have occurred repeatedly (a few are highlighted below). An additional data point we can share, also easily viewed by our Analyst and Portfolio Manager members on our website: VIX GEX is extremely positive until September 9, with all of the negative GEX concentrated at expiries beyond September 9. Might this suggest some weakness over the next 10 days? GEX isn’t a crystal ball, but I’ll leave the conclusion to your extremely capable cranial abilities.
VIX Also Suggests Upward Resolution (for SPX) Into Sept. 16
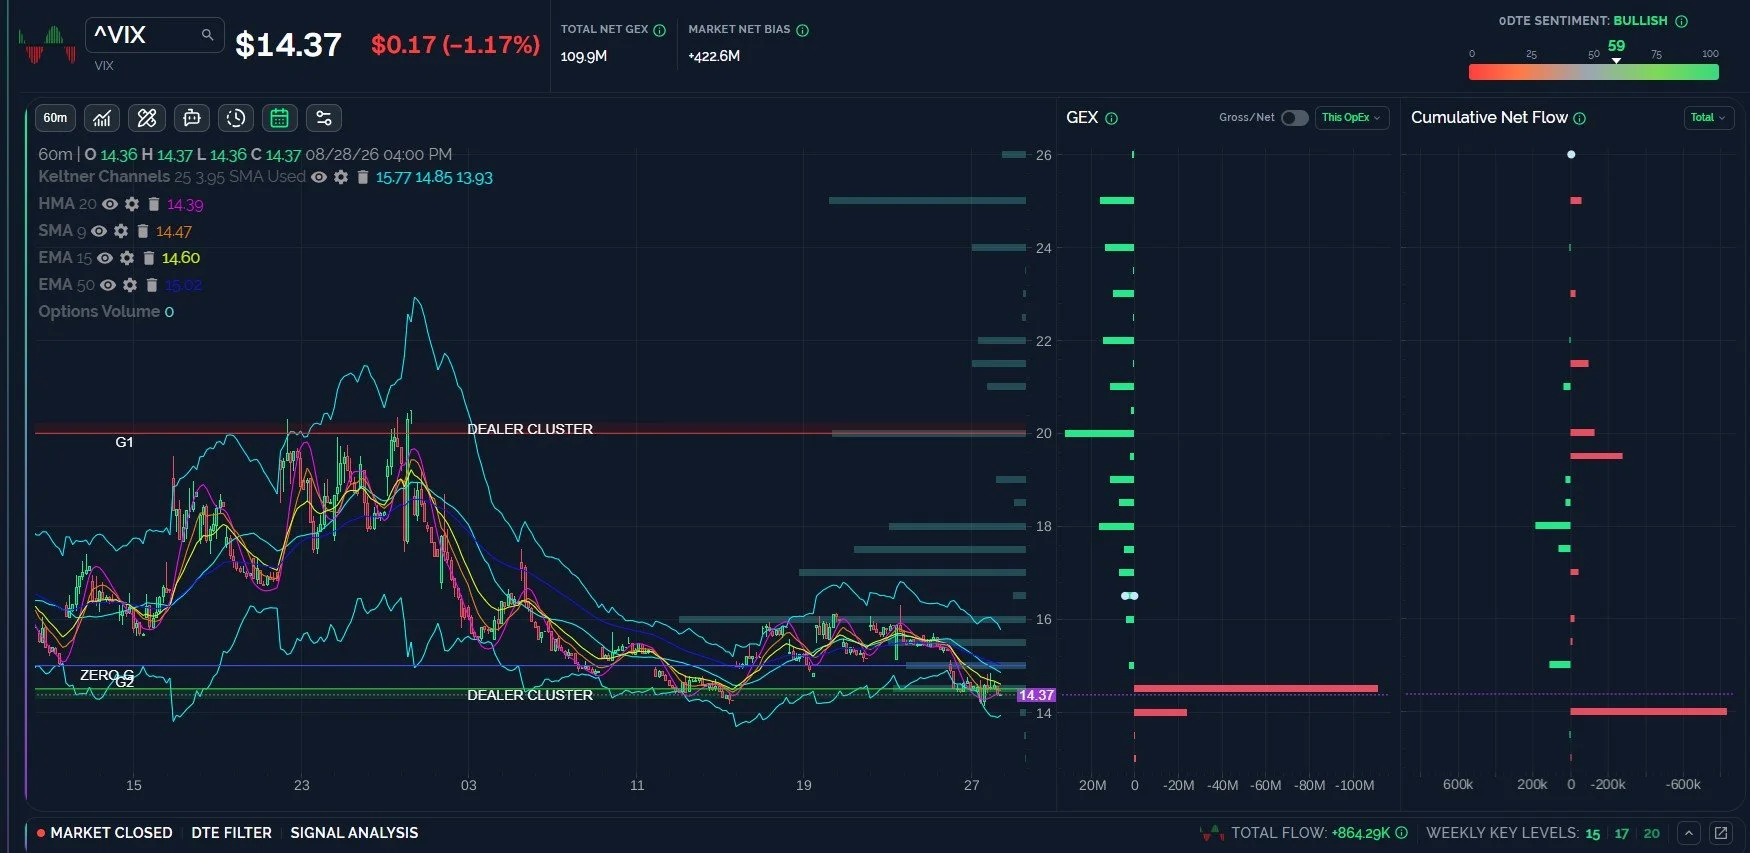
The lower timeframes (especially the 1-hour and 2-hour charts) look abysmal for the VIX, suggesting potential upside of 16.5-17. And when we look beyond the next 10 days or so, the GEX picture remains negative. We’ll look at some reasons why the market may resolve to the upside as suggested by the major indices later on, but even the VIX is consistent with the bullish view into the Fall. We’ll be paying close attention to any VIX spike toward 16-17 and how GEX exposure changes in relation to price action at that level.
Key Levels: Bullish above 15.3 targeting 17, then 20. Bearish below 15 targeting 14.
SPX Appears to be Targeting 8000 by Year-End
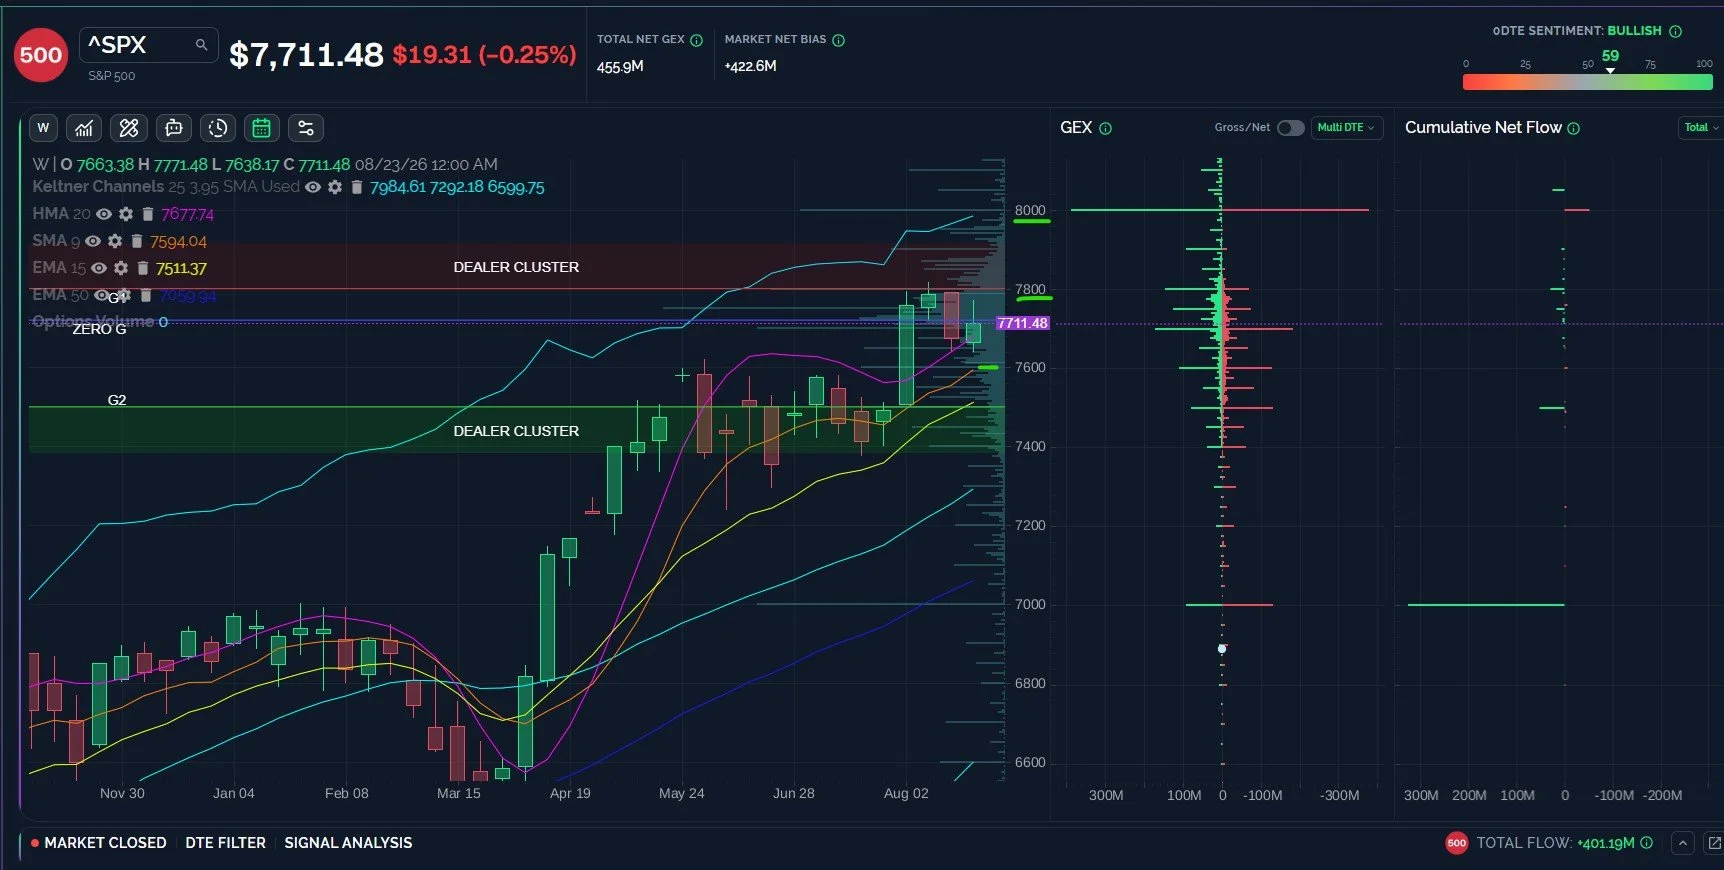
Let’s look at gross GEX next to the weekly chart. We see SPX holding above the HMA as of Friday, and any close above 7678 maintains a bullish bias toward 8000. SPX could even drop to 7600 and we can make a strong argument that the upside scenario is still intact, based on how SPX has reacted to attempted breaches of the weekly 9 SMA since May. The GEX picture leading up to the initial tag of 7000 from below looked fairly similar, though as always, we need to watch for changes in GEX along with price action at key technical areas for additional clues as to the market’s intentions.
Near-term SPX Risk Suggests 7800-7900 Upside, 7500 Downside
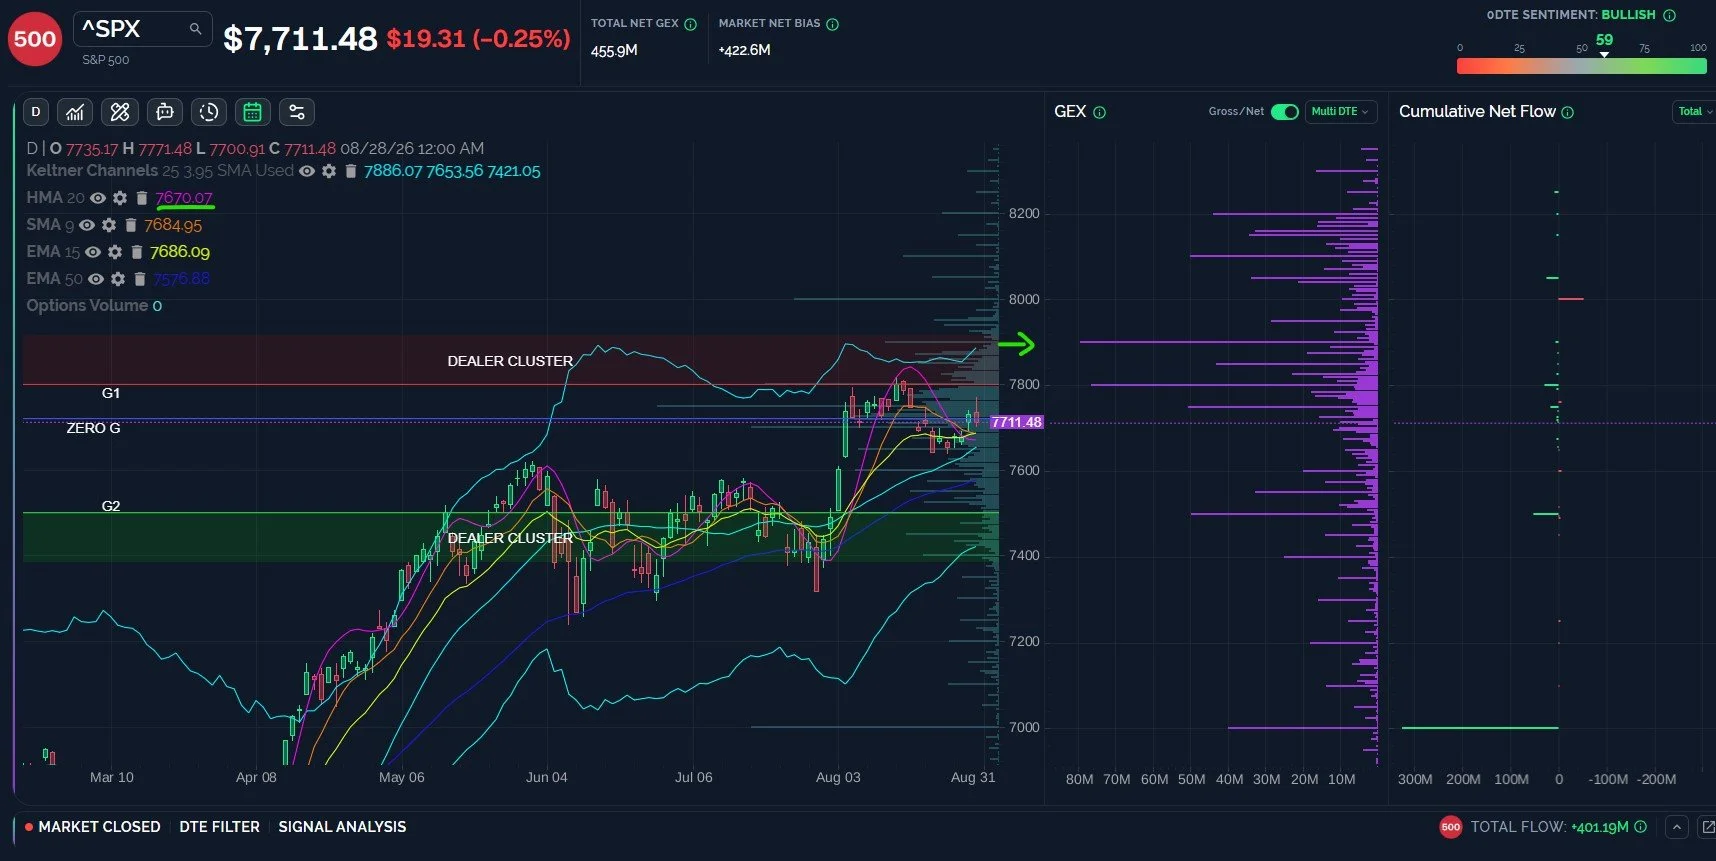
Flipping our view from gross GEX to net GEX, and zooming in to the daily chart, we see 7800-7900 may represent a near-term big resistance zone, especially with the top of the daily Keltner channel at 7886. This zone also marks our upper Dealer Cluster zone, an area where dealers might become sellers. I’m also watching the daily Keltner at 7670, very close to that weekly 9 SMA level we just discussed, further bolstering my view that bulls have some wiggle room here. 7670 would simply retest the thick zone of moving averages on my chart, some of which have already flipped to an upside bias. A loss of 7670 may bring 7600, then the big net GEX zone starting at 7500.
Key Levels: Bullish above 7700 targeting 7800-7900. Bearish below 7700 targeting 7670, 7650, 7600.
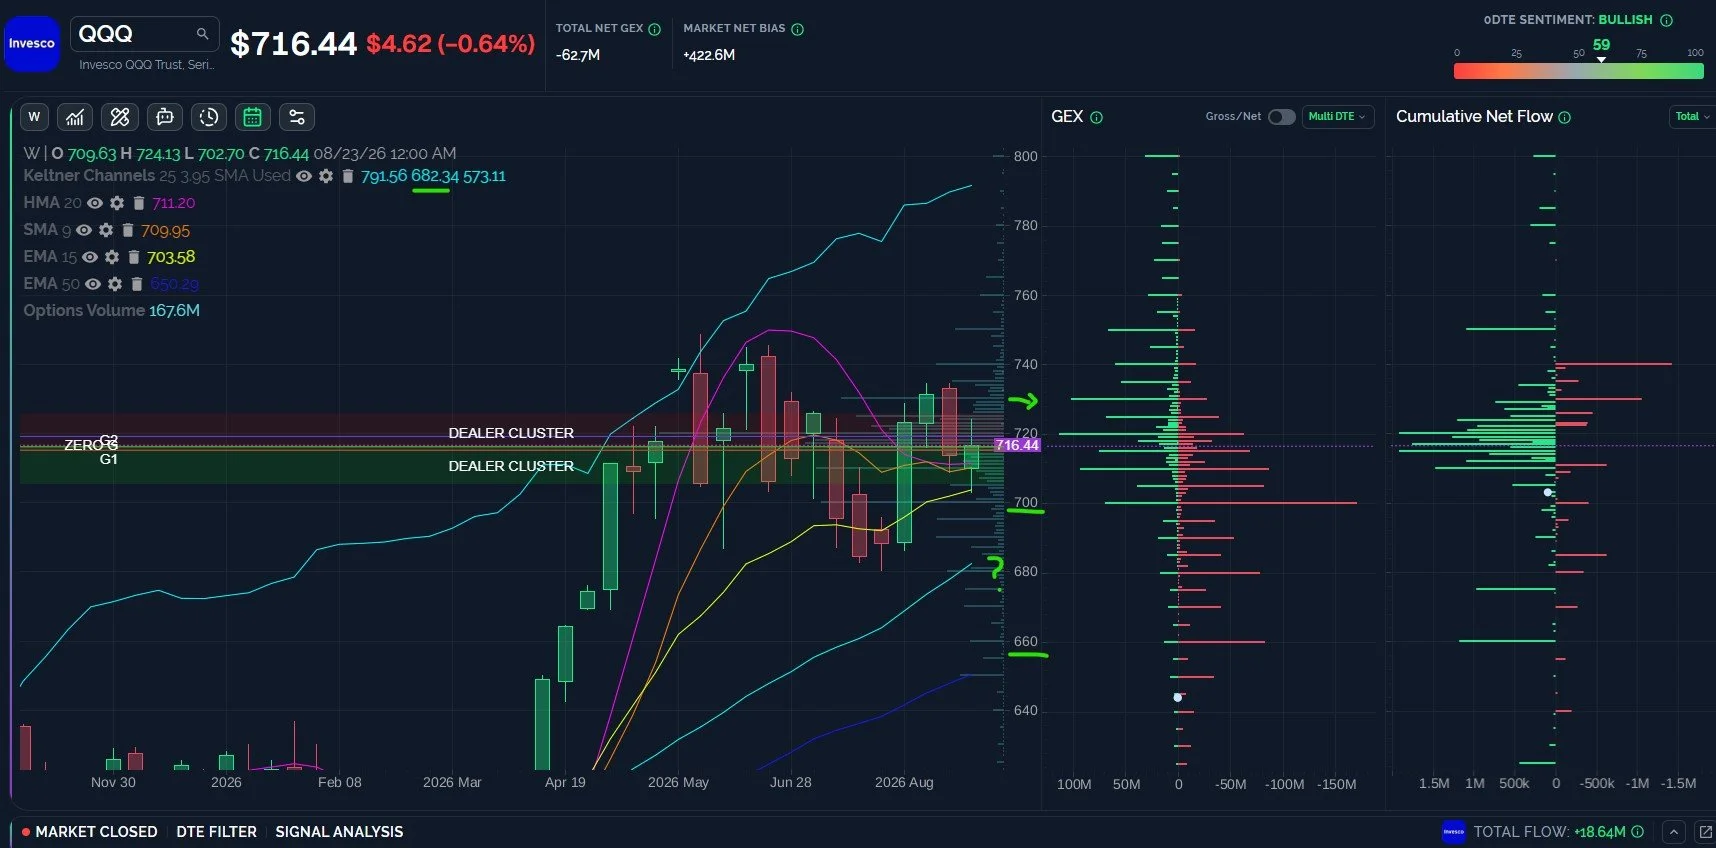
QQQ 700 May Decide Whether we See 660-680 or 730 First
QQQ still maintains above the big 700 GEX area, keeping alive the potential for a trip to 730 or higher. A loss of 700 would be a big red flag, potentially signaling 680 or 660 as targets, especially if we can’t close at or above 700 on a daily basis.
Key Levels: Bullish above 700 targeting 720, 730. Bearish below 700 targeted 680, 660.
Join The Discussion
We hope you will join us in Discord this week, where we will share some observations for free. Non-subscribers can join through Community on our homepage. First-time guests get a free 7-day trial of the premium Discord channels, where we talk through what is happening in real time.
Our YouTube videos can be viewed by clicking Community at the top of our homepage to find the channel link. We posted a new one Sunday evening that we think you’ll enjoy!
Join our livestream by clicking the link on our homepage every day around 10:30am ET, and you can replay the most recent one any time before the next one begins. We also post this link in Discord when we’re ready to start.
We now have a live demo on our homepage for those who want to explore the main sections of our website, so we invite non-members to check it out!
Thanks for being part of our community and know that we invite and appreciate your feedback!
The information provided by Geeks of Finance LLC is for educational purposes only and is not intended to be, nor should be construed as, an offer, recommendation or solicitation to buy or sell any security or instrument or to participate in any transaction or activity. Please view our Investment Adviser Disclaimer and Risk Disclosure.
