
SPX Bears Receive Endangered Species Status
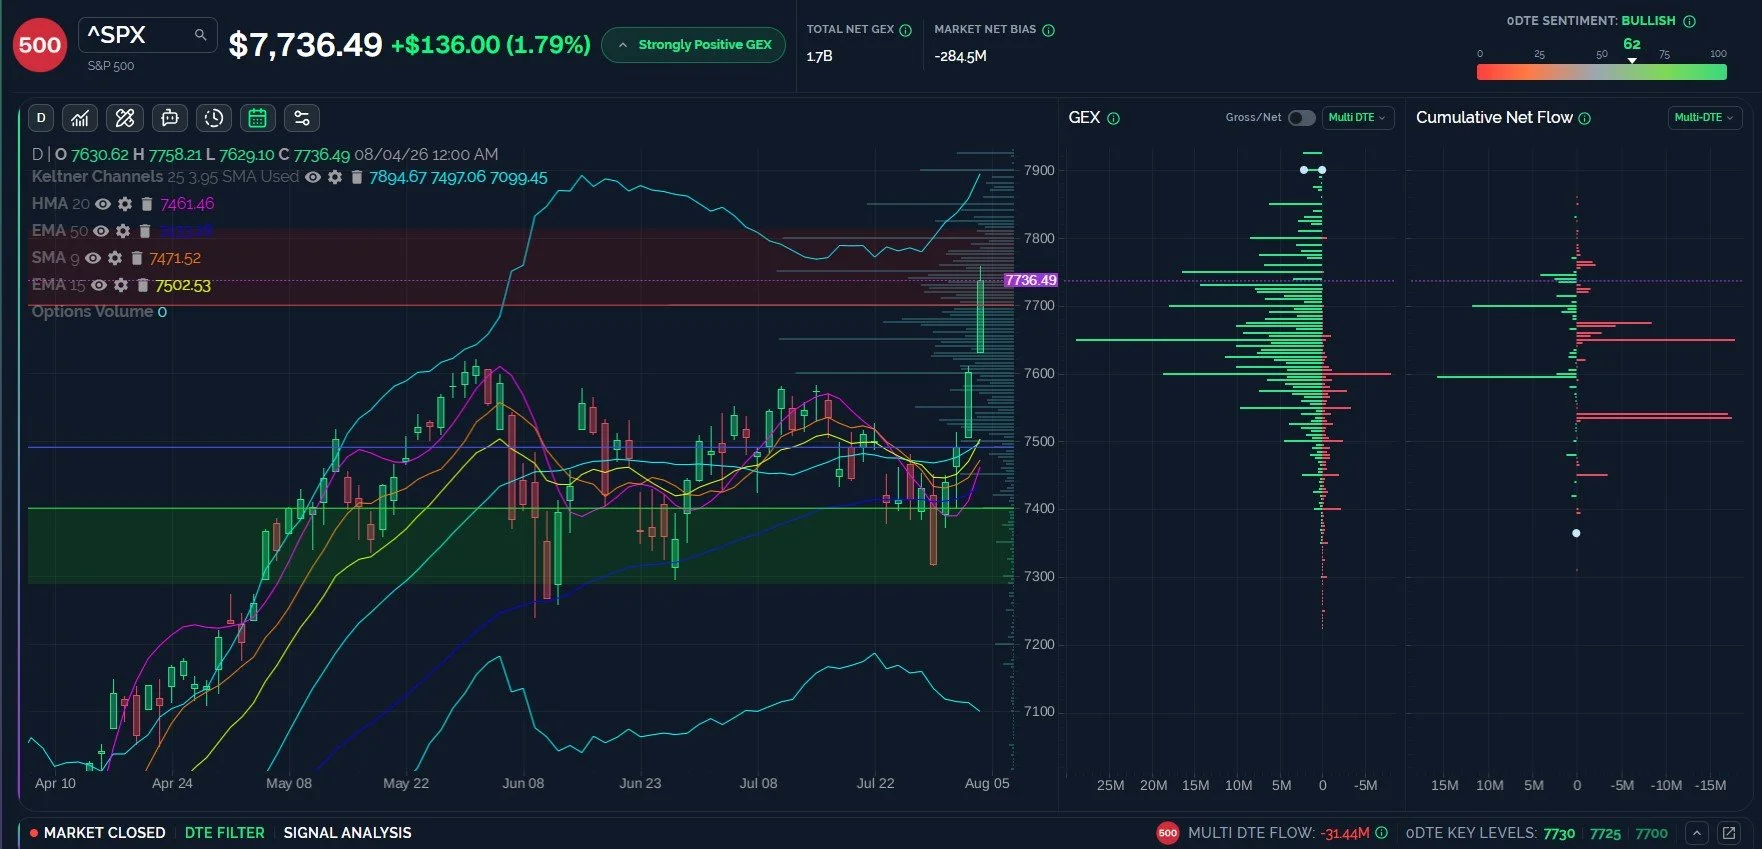
Shorting too early can be detrimental to a directional traders’ health, and today was a great example, with SPX rising a whopping 136 points and QQQ rising almost 24 points. Yesterday’s newsletter suggested that SPX holding over 7600 would target 7700, as unlikely as that seemed, and yet here we are, at 7736. Alas, we also see the VIX up by a greater percentage than the S&P, and we said the VIX was primed for a move toward 18. We haven’t seen 18 yet, but that elusive “pullback” may be right around the corner…Whether bears have to endure one more day of pain or so is yet to be seen.
Members save $300 on the annual Portfolio Manager plan with code SUMMER26 at checkout, which will run a few more days.
We also have a new offering for longer-term investors- appropriately named The Investor, featuring valuation analysis, customizable valuation model inputs, and A.I-assisted earnings report data and a lot more, and at a much lower price point than our competitors! Check it out on our homepage (link toward the end of the newsletter).
SPX: Weekly GEX Is Mostly Between 7600-7750, Option Flow Negative
Two days in a row of 100+ point moves from low to high on SPX is not just unusual, it’s unprecedented. You would expect big moves after a 35% drop, but from a paltry 3% drop is unheard of. I can’t find any similar comparison on my chart. While certainly a sign of strength, and a move that fulfilled our targets set forth yesterday given that we held above 7600, the speed of the move and the GEX picture cast some doubt on the sustainability of any continuation higher without consolidation. The weekly GEX picture and cumulative net flow for this week show a more subdued picture, with most of the GEX concentrated between 7600 and 7750, with 7800 and 7550 marking possible extremities. The upper dealer cluster zone shifted higher with the GEX picture essentially chasing the price move, and yes, just as we were yesterday, we’re in the upper zone again. The lower Keltner channel on my chart is still aiming lower, and the cluster of moving averages are currently around 7500, so mean reversion back to 7650-7600 or lower is possible (and we believe likely) from today’s close or even a little higher, based on the GEX picture.
Key Levels: Bullish above 7750 targeting 7800, then 7850 (barely over 1%). Bearish below 7700 for a retest of 7600-7650, where we’ll watch price action in real-time to decide what we believe is the most likely next step.
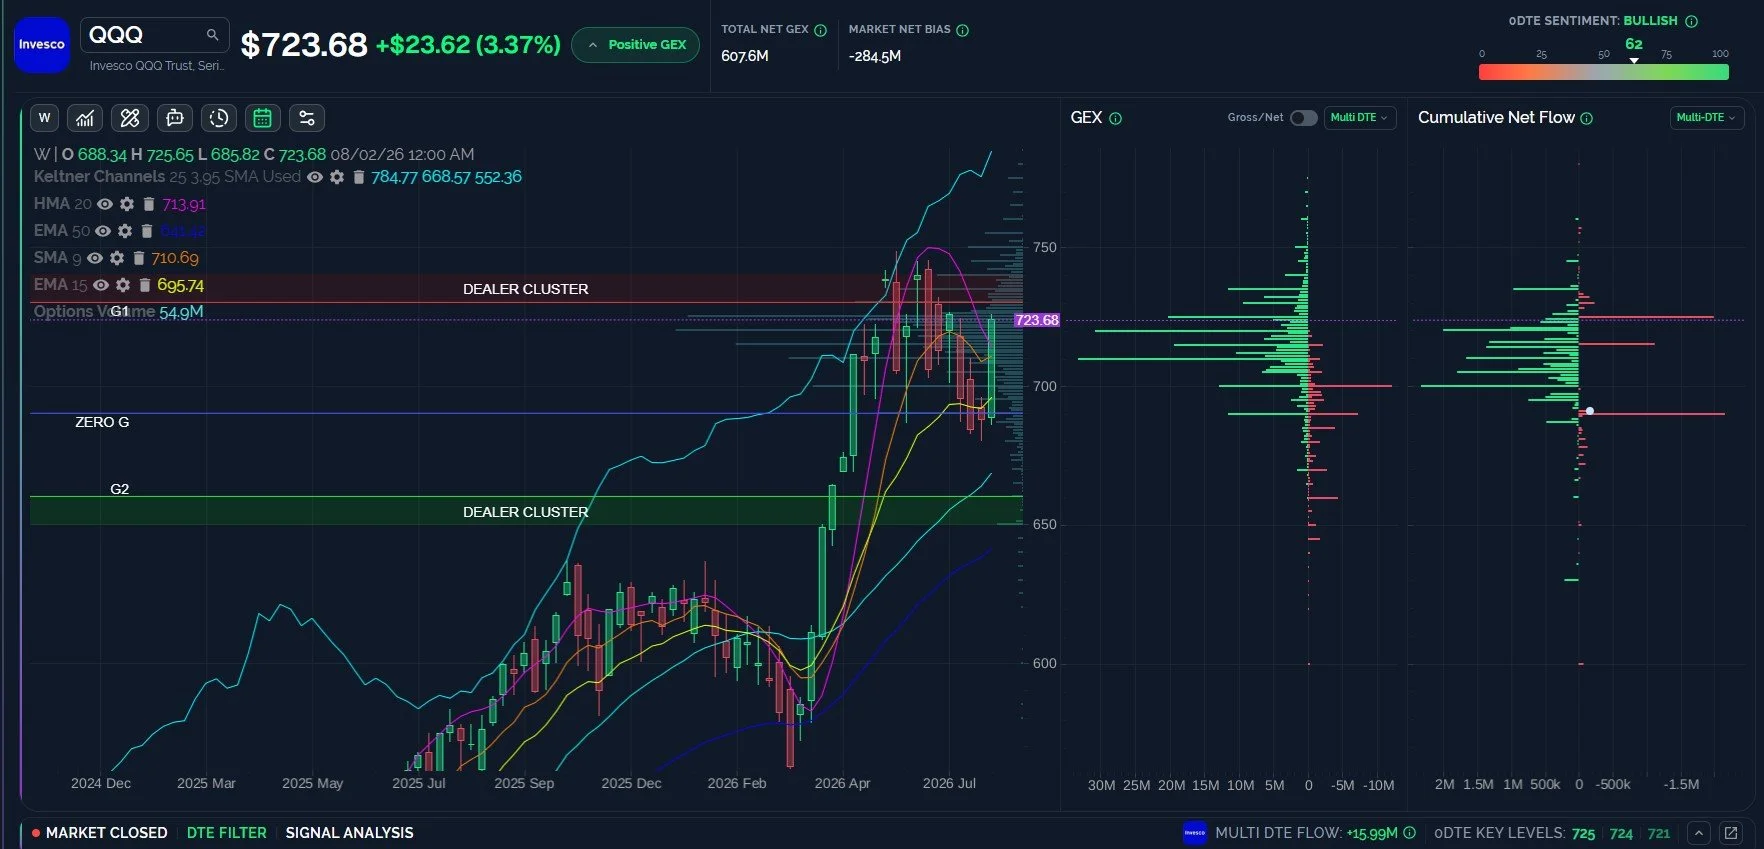
QQQ Closed Rallied 23 Points, Closed Above The HMA, Limited Upside
QQQ is still well below highs, though option flow was more positive for QQQ and we see a close above the weekly HMA today. QQQ really needs to hold above 714 (in our view) to maintain the bullish picture of rallying to new highs, otherwise, this is a bull trap as QQQ fails to make new highs and heads toward 660. The GEX picture is certainly uninspiring, with most of the GEX concentrated between 690 and 740 for this week, and expanding the view to the OpEx cycle through August 21 shows a range of 680-740. In summary, the move looks bullish, but we view the odds-favored move to be some sort of pullback before attempting significantly higher levels, if such an attempt is set to occur.
Key levels: Bullish above 720 targeting 740. Bearish below 720 targeting 710, then 690-700.
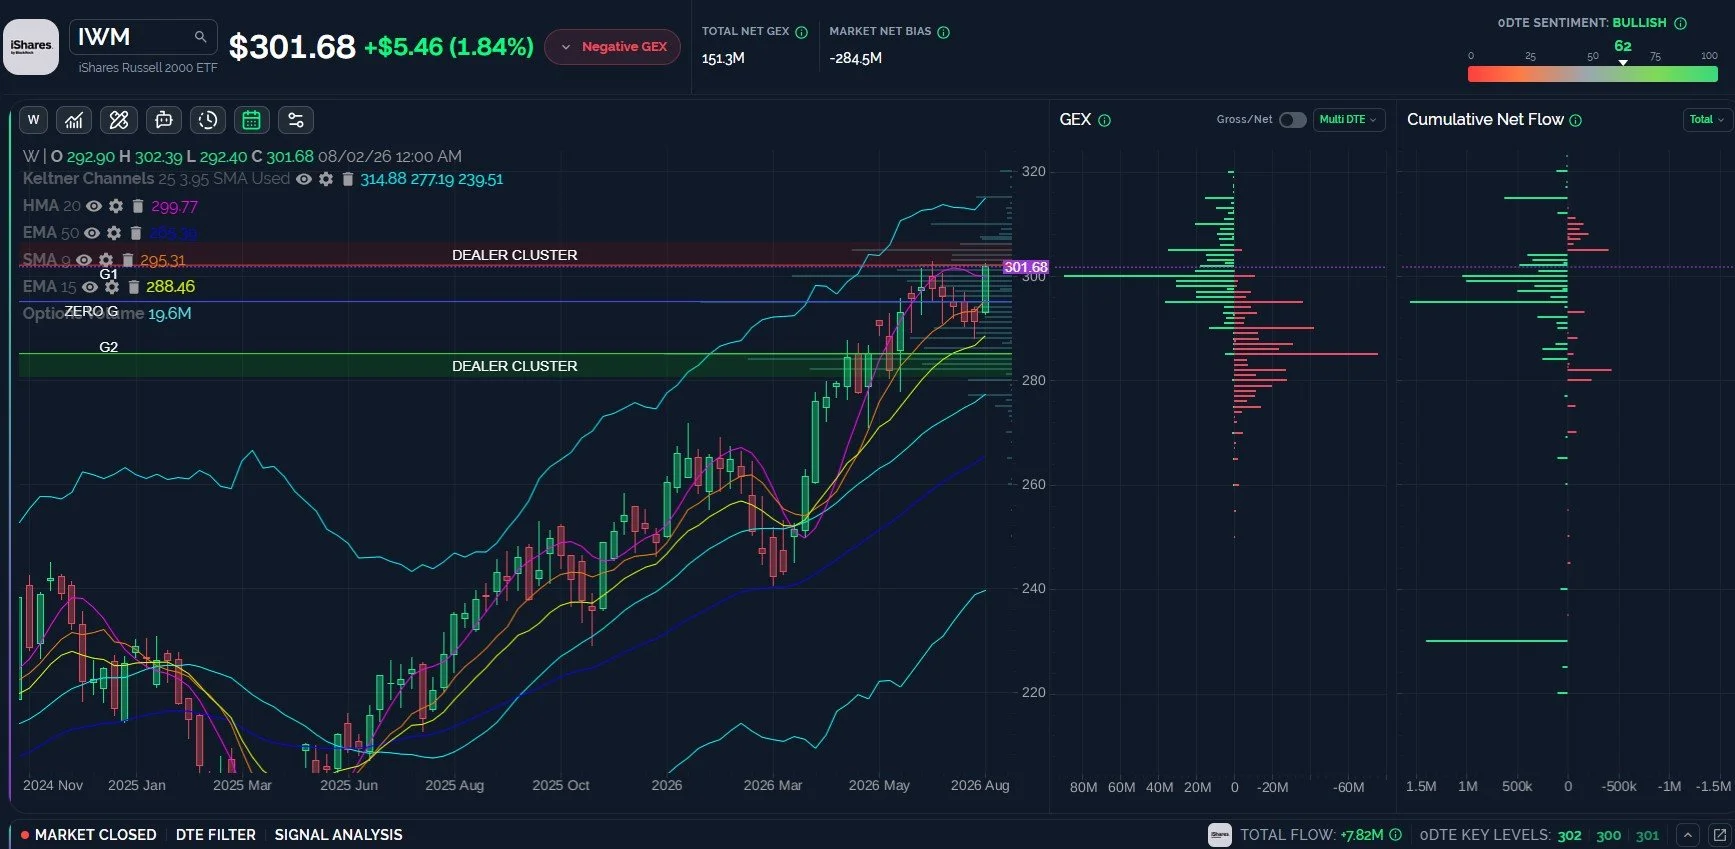
IWM Fulfills A Close Above 300, 310 Next?
IWM never broke character with its bullish action lately, rallying above 300 for a new closing high today at 301.68. The weekly chart shown below looks bullish. As long as IWM holds above 280, we believe dips are to be bought. In contrast, the daily chart looks more neutral, with 310-315 likely capping upside and risk to 285 being in focus on any break of 300 to the downside. Interestingly, the shift in GEX away from 290 now shows 285 to be more significant in net GEX terms.
Key Levels: Bullish above 300 targeting 310-315, bearish below 300 targeting 290, then 285.
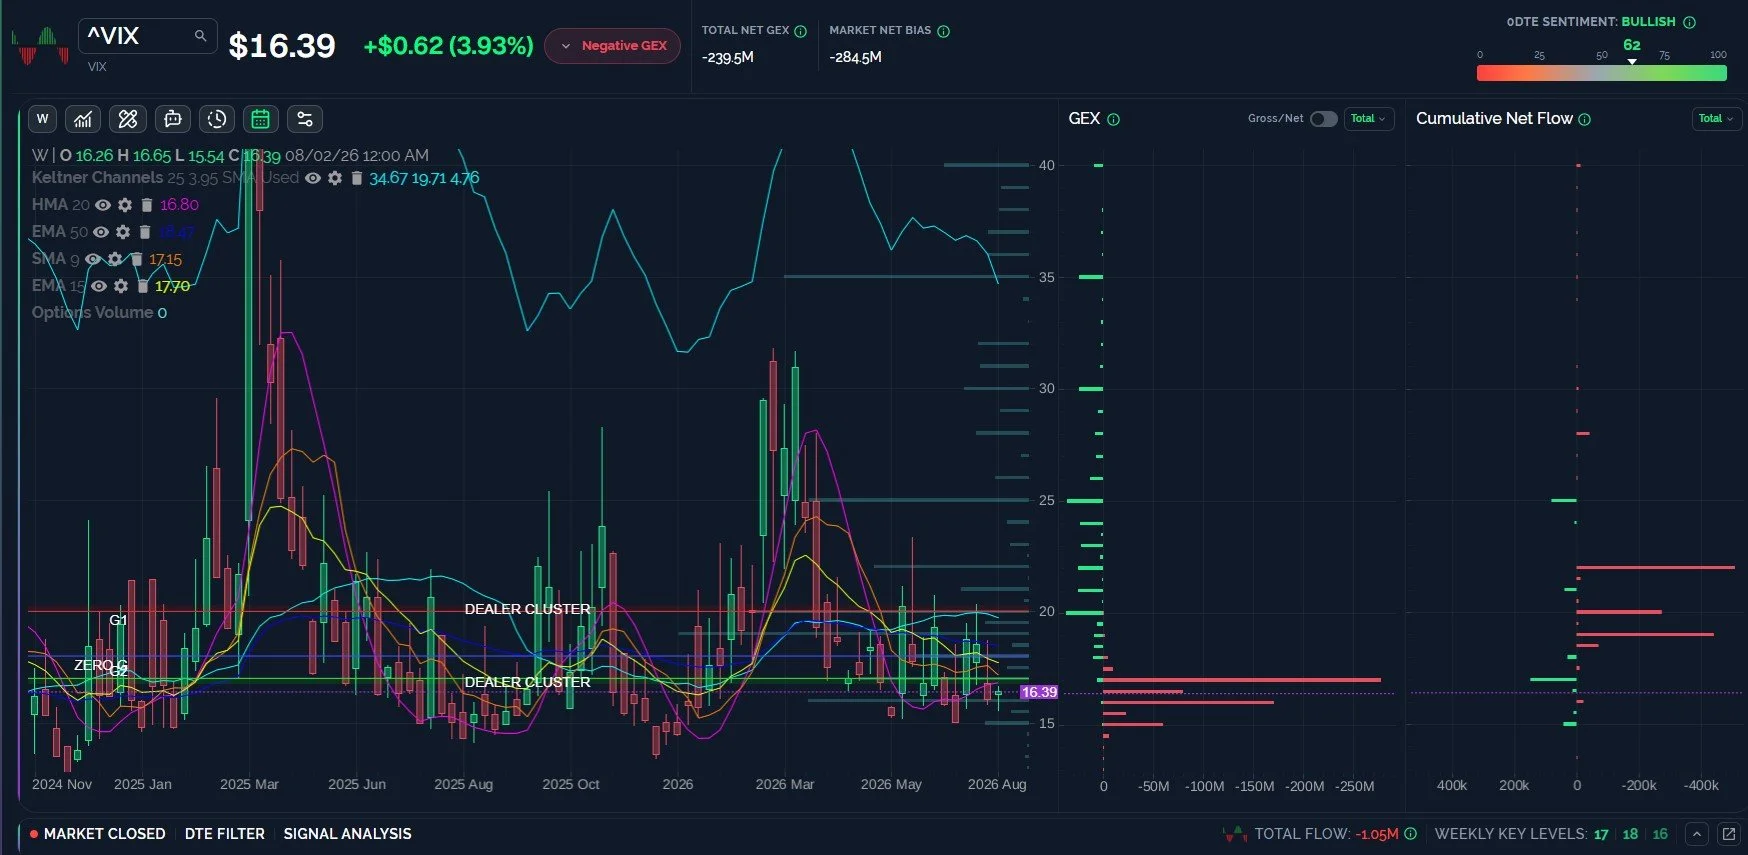
The VIX Picture Is Less Clear- Downside Or Upside First?
The VIX didn’t reach 18 yet, which we viewed as a likely target as of Monday’s close, but we did see an almost 4% rally in volatility, greater than SPX itself (in percentage terms). The 2-hour chart actually looks bearish for the VIX though, so I currently expect any attempt toward 17-18 to be rejected, with a tag of 15 appearing to be possible. That said, as we’ve seen all year, the current odds of moving below 15 for more than a very short amount of time appear to be very low, and an immediate reversal could occur, given the move to extremes in other indices. Tactically speaking, we need the VIX to hold above 17 to bring about a potentially fast move toward 20-25. The reduction in GEX at strikes between 17-20 may imply a clear runway to higher levels as negative GEX has gotten quite large between 15-17. Note the shift of the GEX at 20 from a lot of positive and negative GEX to a clean net positive GEX reading (less of a ceiling, more of a potential magnet above 17).
Bullish above 17 targeting 20-25. Bearish below 17 targeting 15.
Join The Discussion
We hope you will join us in Discord this week, where we will share some observations for free. Non-subscribers can join through Community on our homepage. First-time guests get a free 7-day trial of the premium Discord channels, where we talk through what is happening in real time.
Check out our YouTube video tonight, covering SPX, the VIX, PANW, APP, and QQQ. You can watch the new video by clicking Community at the top of our homepage to find our YouTube channel link.
Join our livestream by clicking the link on our homepage every day around 10:30am ET, and you can replay the most recent one any time before the next one begins.
We now have a live demo on our homepage for those who want to explore the main sections of our website, so we invite non-members to check it out! We hope you’ll join us as members.
Thanks for being part of our community and know that we invite and appreciate your feedback!
The information provided by Geeks of Finance LLC is for educational purposes only and is not intended to be, nor should be construed as, an offer, recommendation or solicitation to buy or sell any security or instrument or to participate in any transaction or activity. Please view our Investment Adviser Disclaimer and Risk Disclosure.
