
Decision Time for SPX
We saw the VIX spike to almost 17 on Tuesday, a possibility discussed in Sunday’s and Monday’s newsletter, and today we got the bounce in SPX that we discussed last night. That means I’m guaranteed to have the wrong idea in mind tonight, but nonetheless, I will plow through it. Joking aside, indices closed below some big GEX resistance today, even after the rally, and chart indicators are mixed. The VIX crush right back to daily support in the low -15s makes me think we might not be done with the shakeout, since I don’t yet see the charts or GEX ready to see the VIX in the 12s and 13s. Regardless of what happens, let’s look at the major indices and the VIX as we transition to the back half of the week.
Interested in joining our group? Save a rare $350 off of the annual Portfolio Manager plan with code LABORDAY26 at checkout!
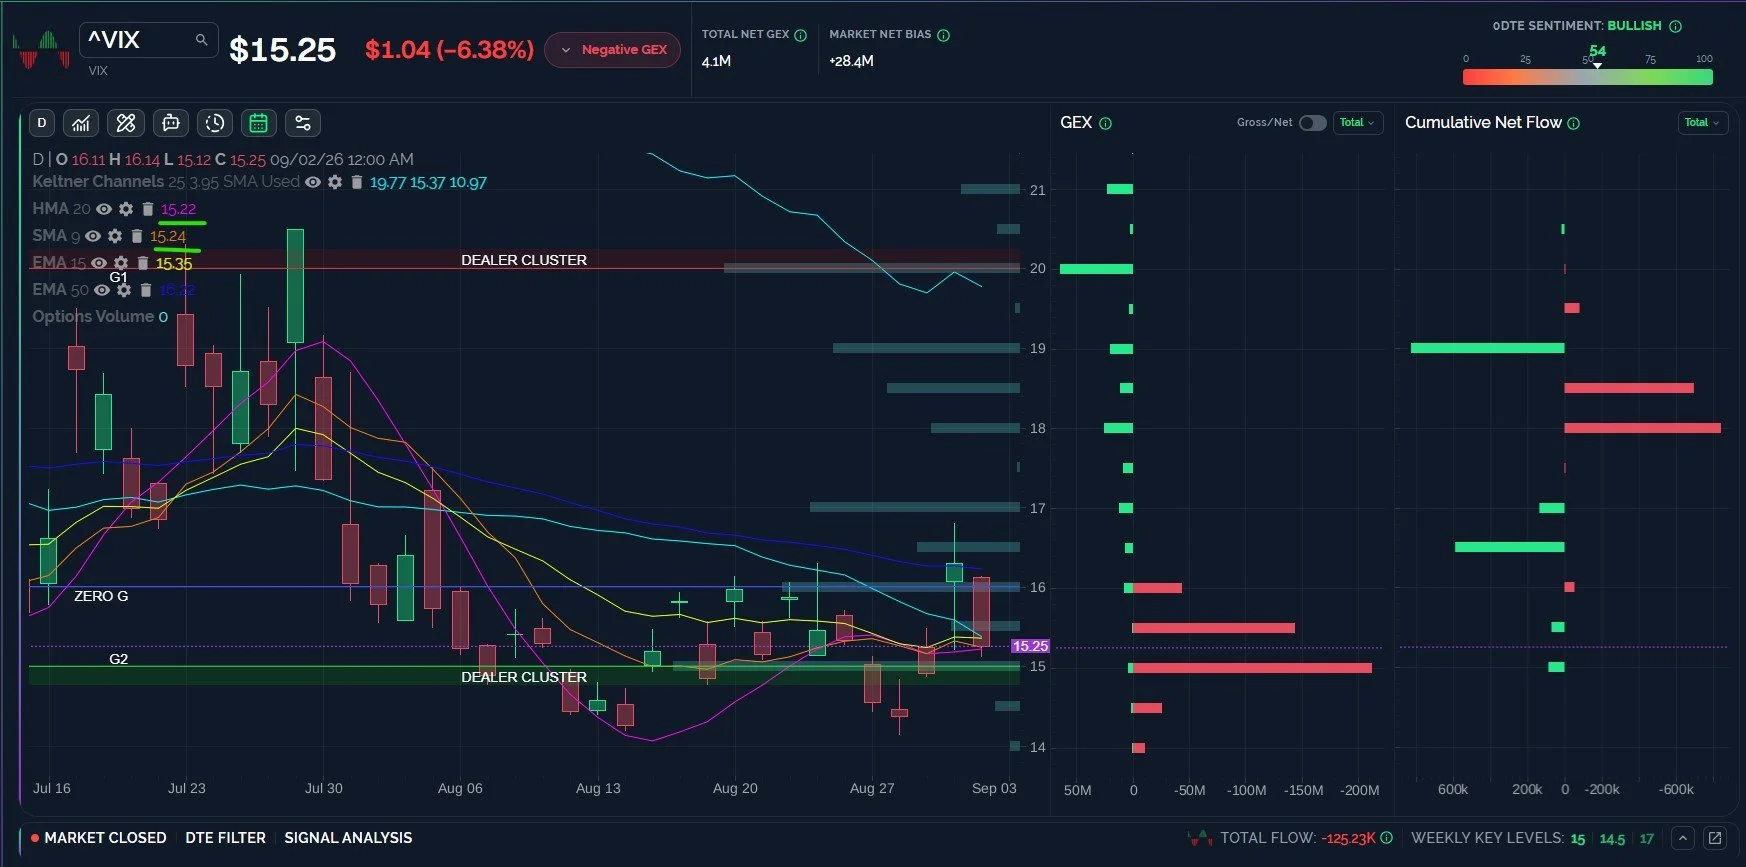
The VIX Drop Stopped at Important SUpport, Smaller Timeframes May Turn Up Soon
As a contrarian, I am worried that the speed of the VIX suppression any time there’s a speck of green on the screen is too fast, participants aren’t getting a good return (the market going up) in exchange for the effort to press the VIX down to yearly lows. We haven’t seen the VIX below 13 since late 2024, so I view the 2nd test and rejection of the 50 EMA in two days from below as a bullish (for volatility) sign of repeated attempts than an important rejection. Third attempt is the charm? The close was pennies above both the 9 SMA and the HMA, and I don’t think it’s an accident that both of those levels were held. I can’t get bearish on the VIX until we see another close below the line. The smaller timeframes (1 hour, 2 hour, and 4 hour charts especially) look like another attempt higher is imminent.
Despite my expressed confidence in the picture for a spike to higher levels, I am not confident that we will see much beyond 20 at the current moment, and a gap down below the HMA on Thursday would do a lot of damage to the bullish VIX picture. GEX currently shows very little GEX below 15, and 15 represents the lower Dealer Cluster zone, so (for now) the odds appear to favor at least a stable VIX going forward.
Key Levels: Bullish (for volatility) above 16 targeting 18-20. Bearish below 15.2 targeting 14.5, then 14.
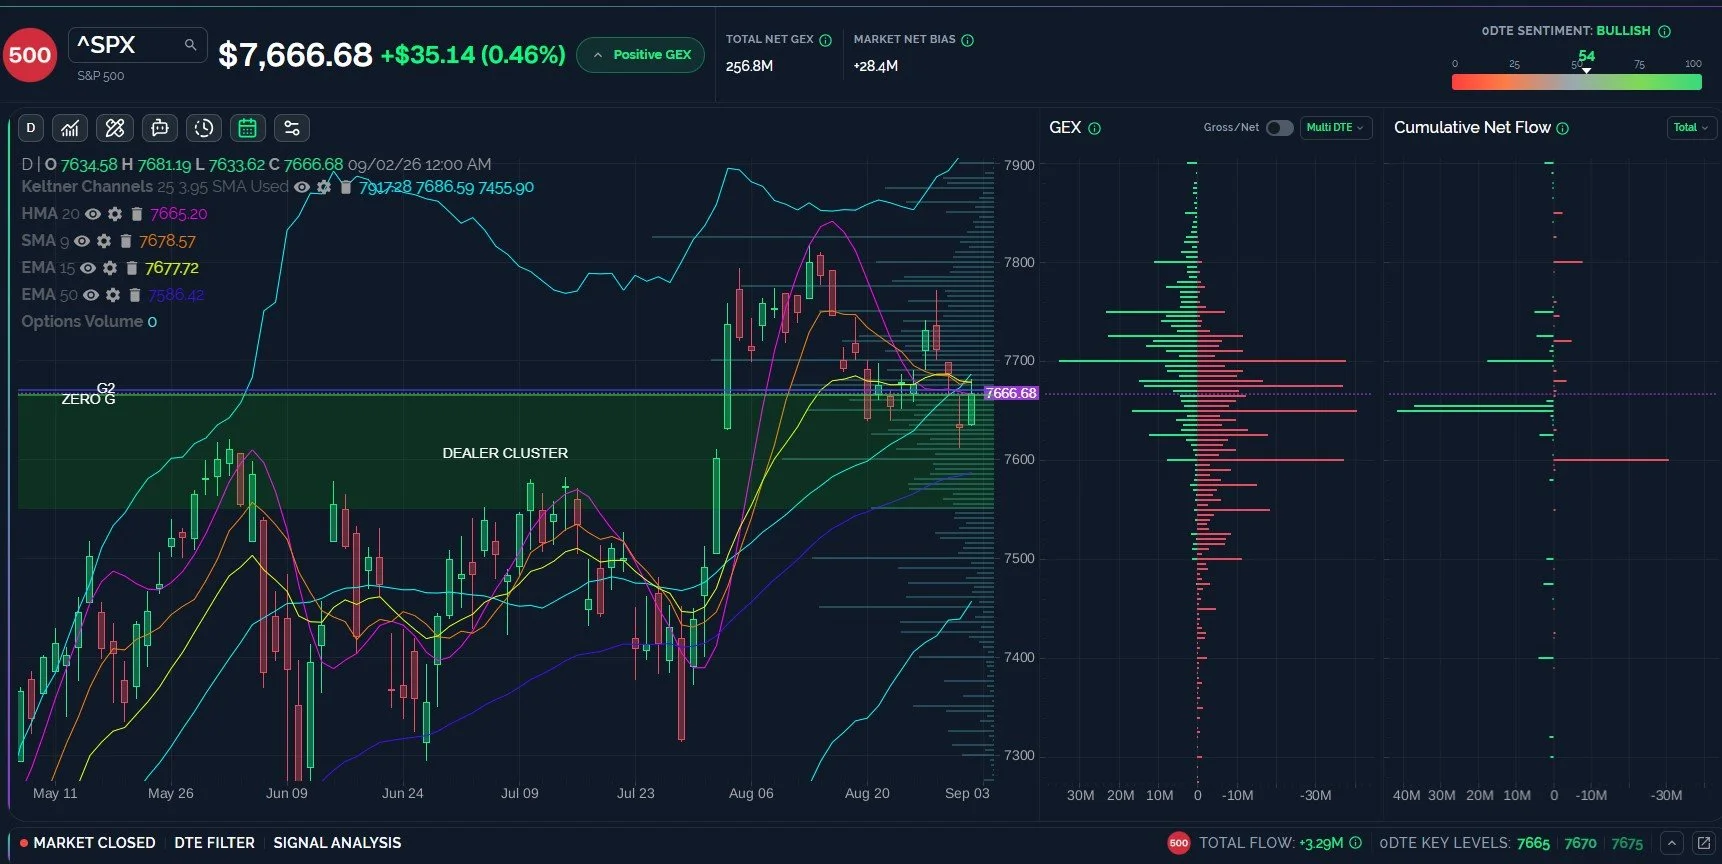
SPX Closed 1-Point Above the HMA, Still a Battle Toward 7700
SPX appears somewhat contradictory to the VIX, looking fairly neutral with a close barely a point above the HMA. Looking at GEX through this week and next week, a move above 7680 increases the odds of reaching 7700, and we really want to see SPX above 7700 to make 7750 the odds-favored target. Staying below 7650 opens the door to levels as low as 7500, roughly 2% below, to bring the day traders back to earth in realization that you may risking too much if a 2% micro pullback causes you to twitch a little.
Key Levels: bullish above 7680 targeting 7700, then 7750. Bearish below 7650 targeting 7600, 7550.
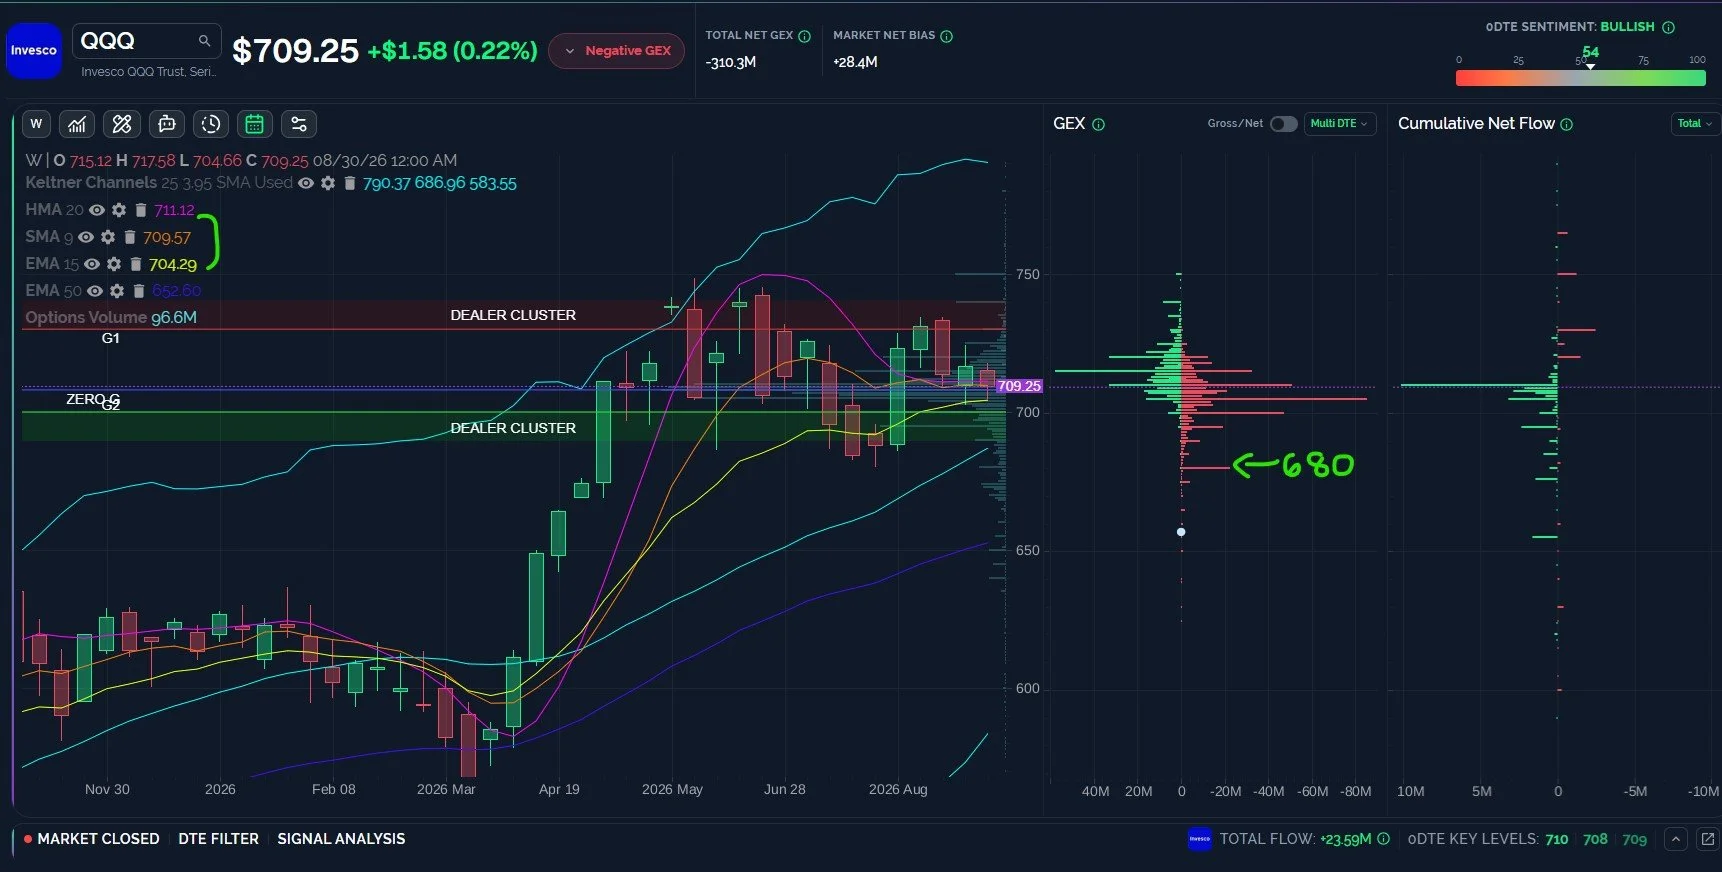
QQQ Was Weak Today, Risk to 680 Into September 9
QQQ is also somewhat divergent from SPX, showing a negative total GEX picture and a daily close below the HMA by 2 points. In addition, we see an eye sore at 680, a large negative GEX cluster 29 points below today’s close. In contrast, the largest visible positive GEX over the next week and a half rests at 720, not even 2% higher. Not all hope is lost for bulls, with QQQ still above the big 700 GEX cluster, and QQQ is notorious for ultimately resolving in the same direction as SPX. If QQQ can get above 715, perhaps we’ll see the GEX picture shift more positive, but until then, we’re mindful of the risk of a gap down or break below 700.
Key Levels: Bullish above 710 targeting 715, 720. Bearish below 700 targeting 680.
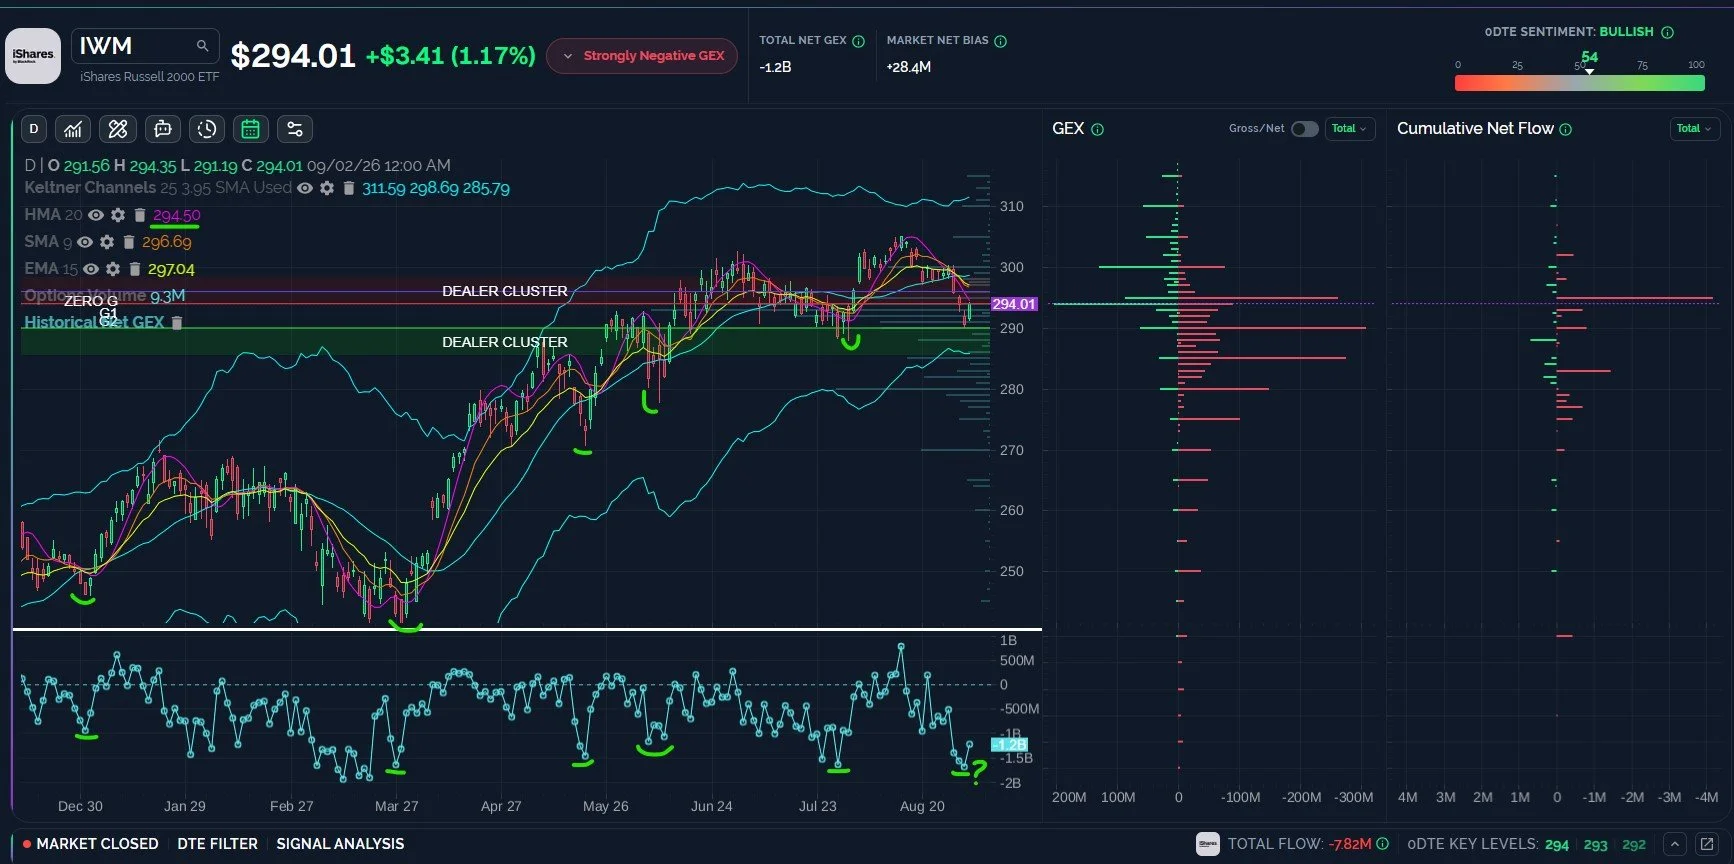
IWM GEX Suggests a Possible Low, Still Below HMA and 295
To flip to a positive note, IWM printed a GEX low similar to previous GEX and price lows this year, with IWM price action often correlating more positively to GEX lows and highs, especially at the extremes. IWM is also approaching the lower Keltner channel on the daily chart. While the daily chart looks about as neutral as they come, the weekly chart (not shown tonight) is still in a bullish formation, so we view dips as constructive buying opportunities on IWM. In the short run, the continued closes below the HMA needs to be resolved with a close above the line to favor bulls, until then, every 5 points between 280-290 appear to be potential buy zones, with 285 appealing the most to me as the lower Keltner channel aligning with a large GEX cluster.
Join The Discussion
We hope you will join us in Discord this week, where we will share some observations for free. Non-subscribers can join through Community on our homepage. First-time guests get a free 7-day trial of the premium Discord channels, where we talk through what is happening in real time.
Our YouTube videos can be viewed by clicking Community at the top of our homepage to find the channel link. We posted a new one this evening that adds additional perspective on the major indices and some additiona stocks as well.
Join our livestream by clicking the link on our homepage every day around 10:30am ET, and you can replay the most recent one any time before the next one begins. We also post this link in Discord when we’re ready to start.
We now have a live demo on our homepage for those who want to explore the main sections of our website, so we invite non-members to check it out!
Thanks for being part of our community and know that we invite and appreciate your feedback!
The information provided by Geeks of Finance LLC is for educational purposes only and is not intended to be, nor should be construed as, an offer, recommendation or solicitation to buy or sell any security or instrument or to participate in any transaction or activity. Please view our Investment Adviser Disclaimer and Risk Disclosure.
