
VIX GEX Rising, VIX Falling?
In last night’s newsletter, we shared our view that SPX was “bullish above 7680 targeting 7700, then 7750.” We saw all of those levels hit Thursday, and the VIX dropped to almost 14. The GEX picture for SPX suggests 7825 might be visited in the next week or so. What do we make of the VIX divergence? We don’t know what the market will do, but let’s look at the indices on a variety of timeframes to see if we can identify levels where we might make quick, tactical decisions in coming days.
Interested in joining our group? Save a rare $350 off of the annual Portfolio Manager plan with code LABORDAY26 at checkout!
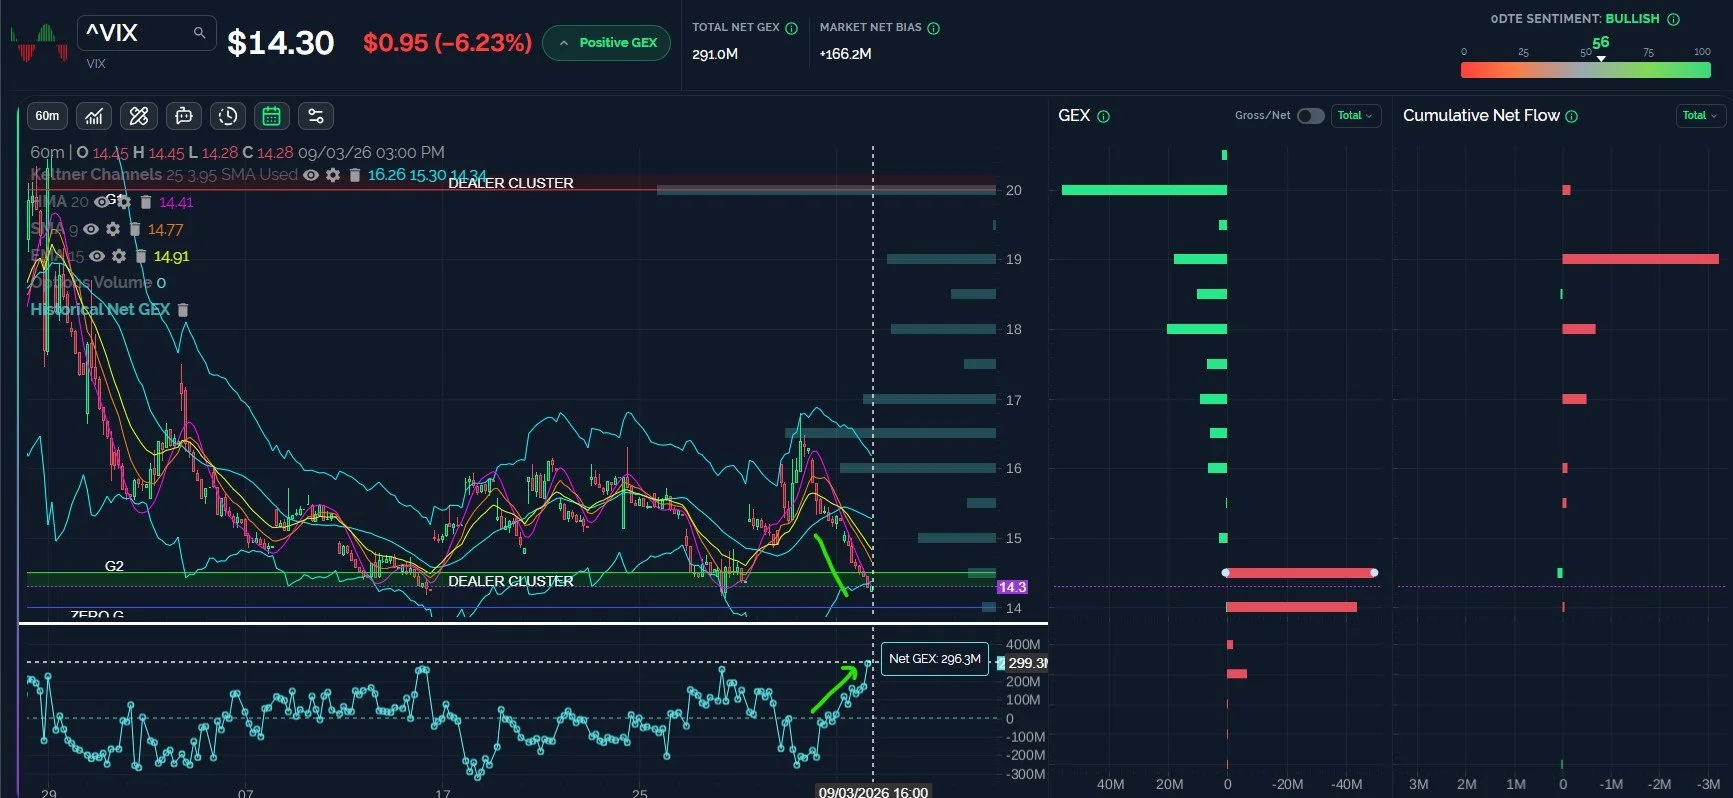
The VIX Continues to Show RIsing GEX, Unseen Divergence This Year
Ever since the VIX high Tuesday at 16.80, the VIX has been on a straight-line descent to lows, reaching 14.32 today. The VIX is now at the bottom of the 1-hour Keltner channel and the HMA is about to touch the lower Keltner, which can be good contrarian indicators of a reversal, when combined. Furthermore, VIX net GEX has been climbing, showing a positive reading last seen in June when the VIX was as high as 23, a glaring divergence. Since the end of July, we’ve seen low net GEX readings on the VIX mark tops, with high GEX readings marking bottoms. Prior to this timeframe, we’ve seen the opposite this year (in general): Low VIX readings at VIX lows, high VIX readings at VIX highs. While the developments today look undeniably bullish for stock indices, the divergences noted in the VIX are very unusual for what we typically see in rebound scenarios, so we will be watching any subsequent moves beyond 16 with a cautious eye.
Key Levels: Bullish (for volatility) above 16 targeting 18-20. Bearish below 15.2 targeting 14.5, then 14.
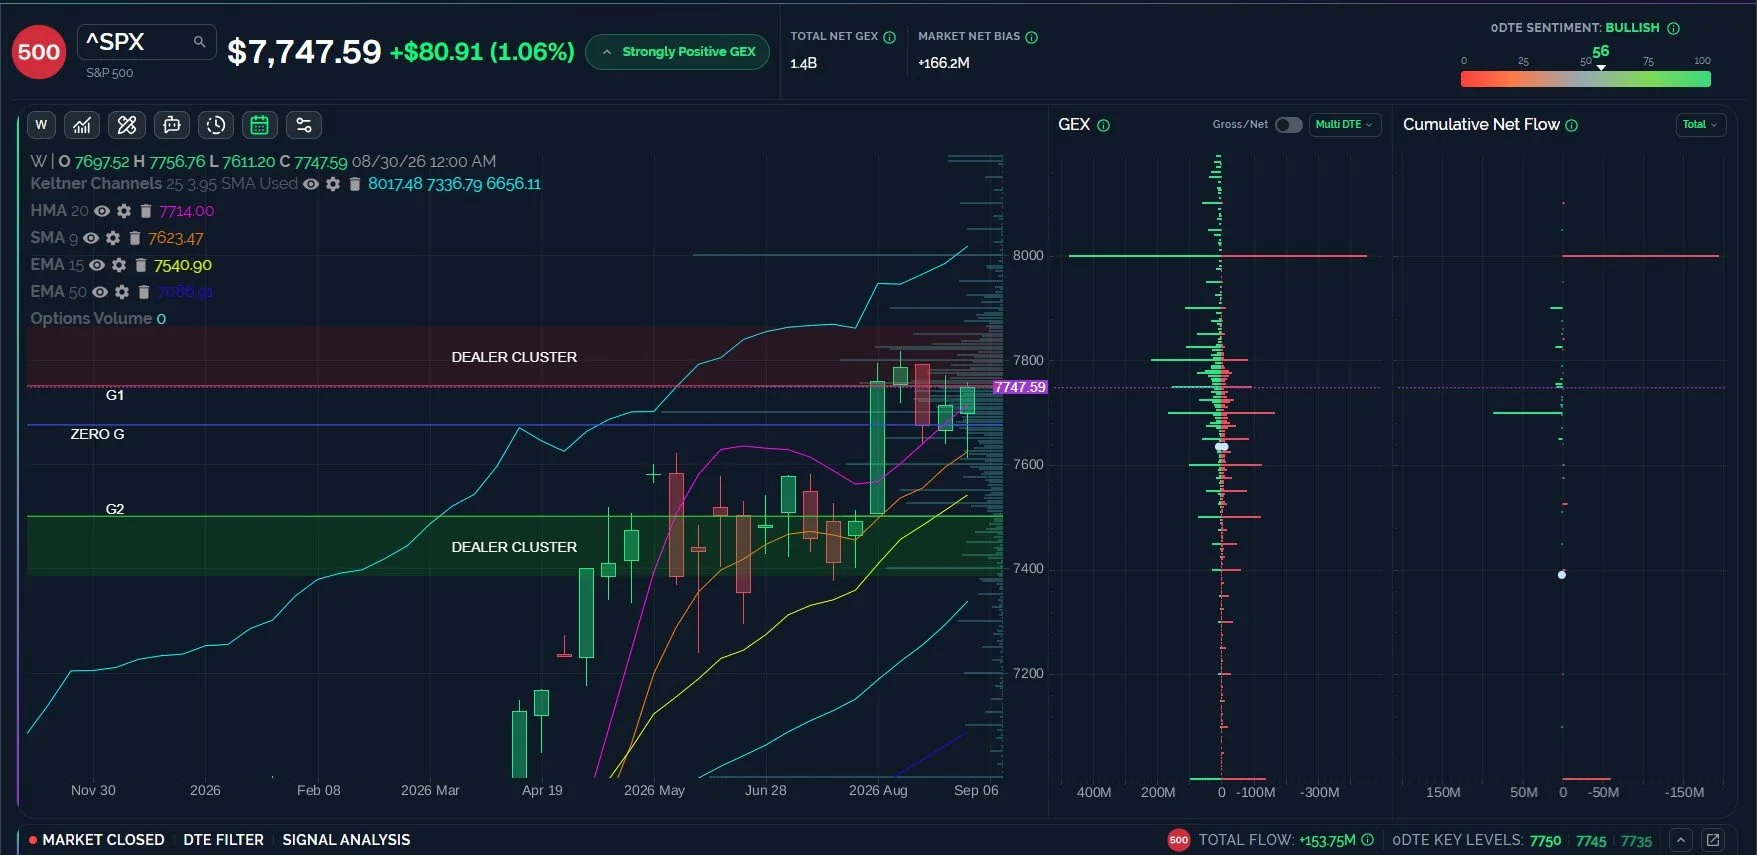
SPX Weekly Picture Still Looks Bullish, Close Above 7714 Looks COnstructive
Starting with SPX’s total GEX picture, we see a lot of GEX on both sides of the aisle at 8000, very much akin to what we saw several months out from the first tag of 7000. 7800 appears to be the largest net GEX cluster on the total timeframe, and reaching 7800 is possible as long as SPX holds above 7714, the weekly HMA. Tuesday’s test of the 9 SMA last occurred a month ago, spurring the rally to new highs, so a loss of the 9 SMA may target the 15 EMA at 7540, also similar to the last 4 times we saw the 9 SMA breached.
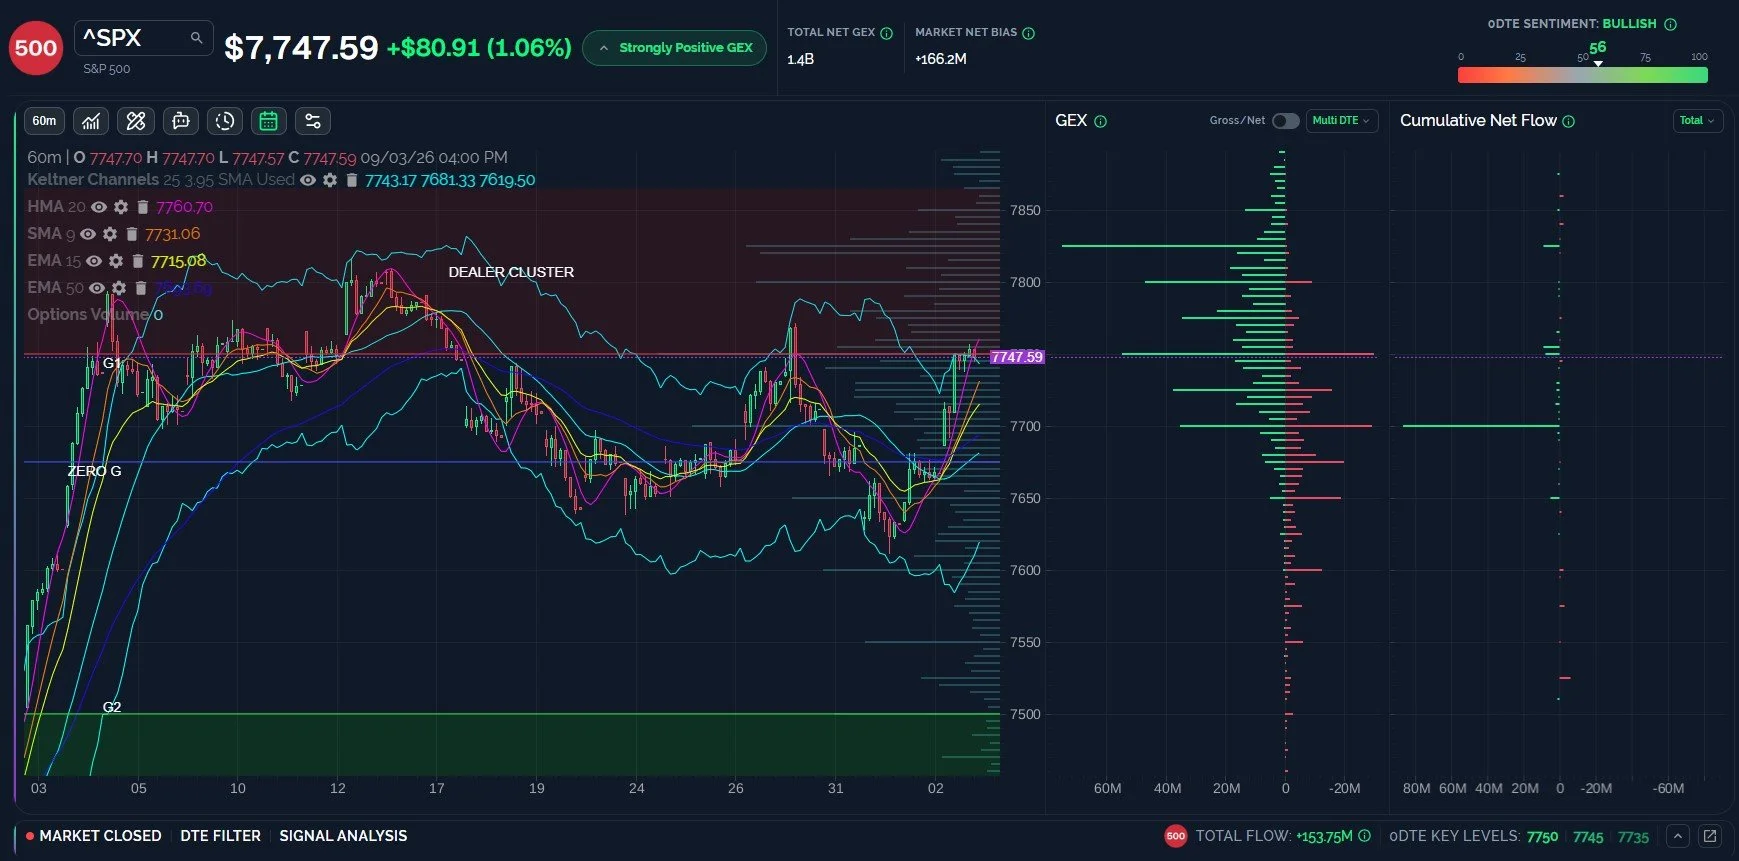
SPX Looks Like it Can Drop SHort-Term, 7825 in Focus Next Week
Zooming in to the 1-hour chart, we see the inverse of the VIX: The HMA surpassing the upper Keltner, which aligns with the upper Dealer Cluster zone at 7750 (but don’t ignore the large positive GEX at 7825), and SPX is now on the underside of the HMA, a long/short flip for me. We still see plenty of net GEX at 7650 to warrant caution if the upcoming consolidation turns into a stronger move, but 7700 and 7725 still appear to be major GEX areas that can slow down any attempted decline, and we have the weekly level at 7714 we just discussed.
Key Levels: Bullish above 7750 targeting 7800-7825, bearish below 7700 targeting 7650, 7600.
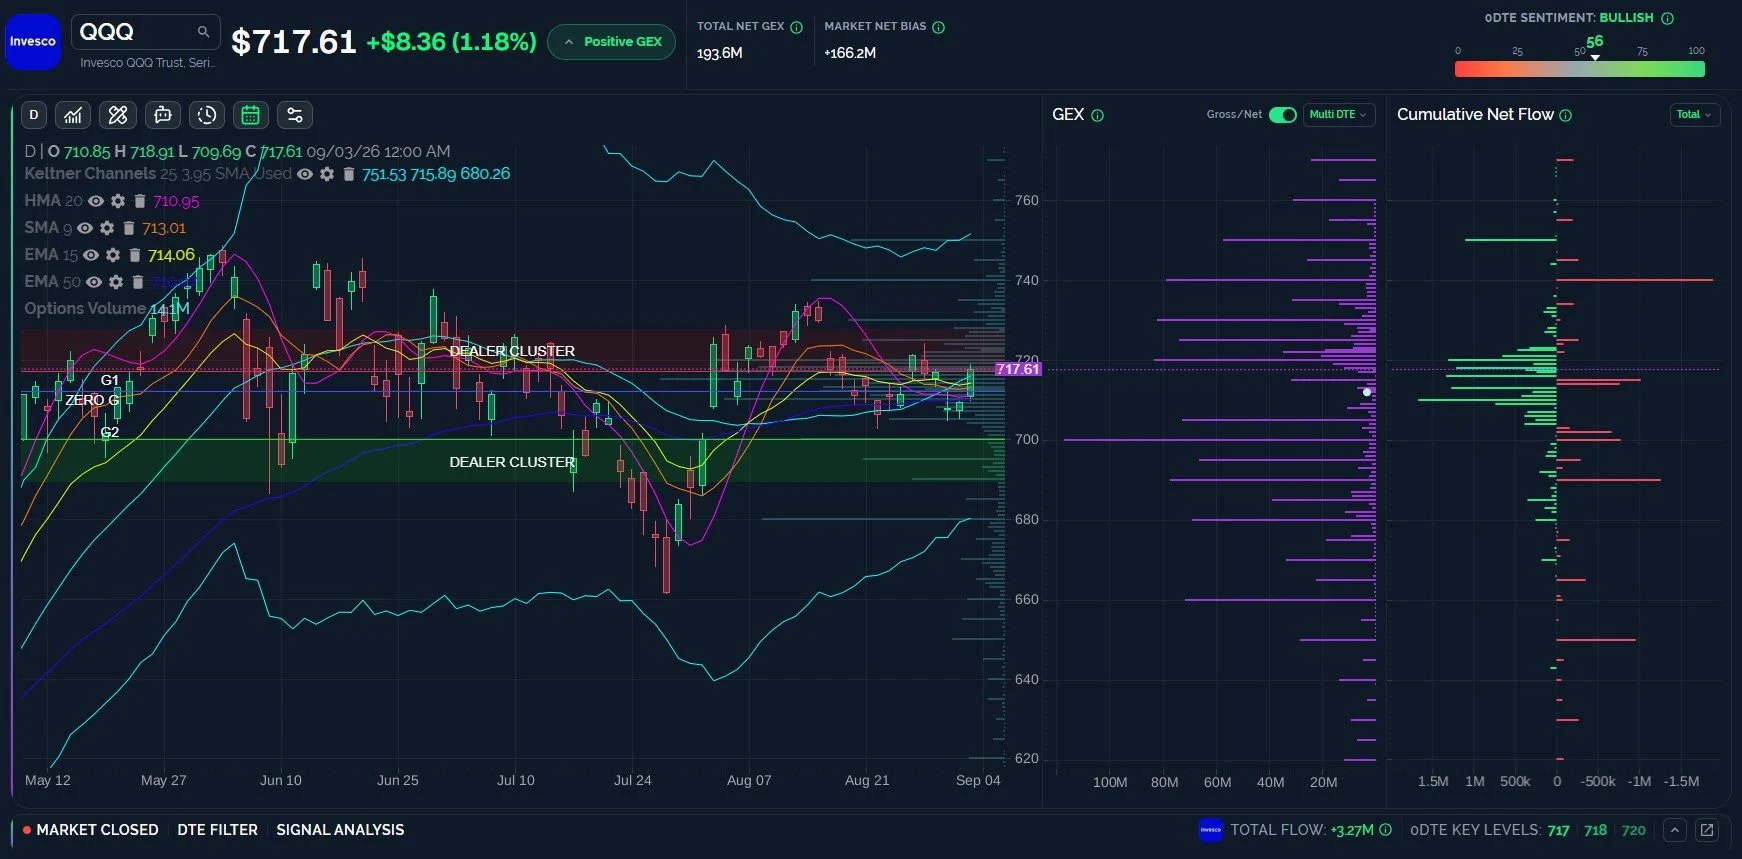
QQQ Net GEX Shows Wide Potential Range of 660-740
QQQ pushed through all of the resistance points marked by my chart indicators, but that’s more of a participation trophy: QQQ still needs to overcome the high reversal candle from 4 days ago, let alone all-time highs. Until then, today’s accomplishment leans positive, but nothing new was accomplished, it’s stuck in a sideways Nessie pattern (in honor of the hoax of Loch Ness- no offense to the true believers) with total net GEX spanning from 660 to 745. What is the proper interpretation of all of the GEX spanning some 85 points? I think the conclusion is that no QQQ participant has any clue what’s going to happen, so hey, throw all of the darts and see if one lands in the bullseye.
Key Levels: Bullish above 720 targeting 730-740, bearish below 710 targeting 700, then 690.
Join The Discussion
We hope you will join us in Discord this week, where we will share some observations for free. Non-subscribers can join through Community on our homepage. First-time guests get a free 7-day trial of the premium Discord channels, where we talk through what is happening in real time.
Our YouTube videos can be viewed by clicking Community at the top of our homepage to find the channel link. We posted a new one this evening that adds additional perspective on the major indices, the VIX, PLTR, and more, so check it out!
Join our livestream by clicking the link on our homepage every day around 10:30am ET, and you can replay the most recent one any time before the next one begins. We also post this link in Discord when we’re ready to start. NO LIVESTREAM FRIDAY 4th, but we’ll be active in Discord!
We now have a live demo on our homepage for those who want to explore the main sections of our website, so we invite non-members to check it out!
Thanks for being part of our community and know that we invite and appreciate your feedback!
The information provided by Geeks of Finance LLC is for educational purposes only and is not intended to be, nor should be construed as, an offer, recommendation or solicitation to buy or sell any security or instrument or to participate in any transaction or activity. Please view our Investment Adviser Disclaimer and Risk Disclosure.
